---
title: "Try out these Frames prompts"
slug: "frames-prompts-and-techniques"
description: "Explore advanced planning Frames in Pigment for sales forecasting, workforce hiring, and OPEX management to optimize your business performance."
tags: ["Opex Planning", "Sales Forecasting", "Workforce Management"]
updated: 2026-09-28T10:53:45Z
published: 2026-09-28T10:53:45Z
canonical: "kb.pigment.com/frames-prompts-and-techniques"
---
> ## Documentation Index
> Fetch the complete documentation index at: https://kb.pigment.com/llms.txt
> Use this file to discover all available pages before exploring further.
# Try out these Frames prompts
> [!WARNING]
> ⚠️ Important
>
> Frames is available in Beta from September 28, 2026. For more information, see the [Beta Features Policy](/v1/docs/beta-features-policy) article.
## Make it yourself!
Use the prompts and visual cues below in the Modeler Agent to generate Frames in your Application.
**Executive overview**
**Explore an executive performance Frame built in Pigment. Revenue, margin, EBITDA, cash, headcount, and NRR against budget, with forecast ranges, variance drivers, and a full P&L drill-down.** [**See it in action**](https://www.pigment.com/hall-of-frames/executive-overview)**.**
(1).png?sv=2026-02-06&spr=https&st=2026-11-12T18%3A12%3A12Z&se=2026-11-12T19%3A12%3A12Z&sr=c&sp=r&sig=N8HVBRiLTgrS3xRvrjdXXURBiz%2FFNLUzMoP1av4dK90%3D)
**What to do:**
**1. **Open and copy the prompt for this Frame. Paste it into the Modeler Agent chat.****
```ModelerAgentprompt
Before building anything, ask me a few quick questions — one at a time, wait for my answer before asking the next one. Don't write any code or create anything until we're through all of them. Use the AskUser card to ask each question. **Question 1**: The attached screenshot is an executive performance cockpit — a static header (title + a one-line data-status subtitle like "Actuals through August, Forecast through December" with an Actuals/Actuals+Forecast/Forecast tag, no filters), a strip of 4 KPI cards (Revenue, Gross Margin, EBITDA, Ending Cash — each just a value, a vs-Budget line, and a vs-Prior-Year line), a risks & opportunities list (~5 items with owner, timing, a probability-weighted impact bar, an in-forecast tag, a region tag), a performance heatmap (KPIs × Region, shaded by favorability), and a flat P&L reference table (Account, Forecast, Budget, Prior Year — no hierarchy, no computed columns). Ask me simply: *"Does this use case match your intent, or were you picturing something a bit different?"* If I say something different, ask me to describe it in a sentence or two and go with that instead of the screenshot's version. **Question 2**: Ask me: *"Should I use made-up demo numbers for now, or hook this up to real data you already have in Pigment?"* **Question 3** (only if I said "real data" in Question 2): Ask me: *"Which List, Metric, or Table should it use?"* Wait for me to name it — don't guess or invent names. **Question 4** (only if I said "made-up demo numbers" in Question 2): Ask me: *"Want me to just fake it for now, or actually set up real Lists/Metrics for this later?"* If I want it set up for real, ask where (which Application/folder) before creating anything. **Then build it.** Tell me first that building the frame can take up to 10 minutes. Before writing any code, open and actually look at the attached screenshot — every panel. Skipping this step is the single biggest cause of a wrong build (and a wrong build is far slower to fix than reading the image once up front). Use my answers for what the tool actually does and where its data comes from. For the *look* — colors, card layout, fonts, spacing — match the attached screenshot's style exactly, regardless of what we land on for Questions 1–4. Write the Frame in one file pass — assemble the full body and write it once (or in 2–3 large passes at most), not as many small incremental edits. The dataset and design tokens below are for you to wire directly into the code; reference them by name in your own response rather than re-pasting the full arrays/objects back — restating them adds length without adding anything I need to review. **The screenshot may show a mid-edit or scrolled state, not necessarily every panel at once** — don't try to match any one frame of it pixel-for-pixel if a panel below is described differently; the panel descriptions and dataset here are the source of truth for scope, the screenshot is the source of truth for visual style only. **Deliberate scope cuts versus the original design** (this cockpit was originally a 7-component build; this version keeps 5 of the simplest, cuts everything expensive or interactive):
1. **Forecast Landing panel is gone entirely** — the 3 range sliders (Revenue/EBITDA/Cash, Downside→Budget→Forecast→Upside with a Prior-Forecast marker) are not part of this build.
2. **Variance waterfall is gone entirely** — no bridge/connector chart, no Metric/Comparison toggles, no 5 named drivers. This was the single most expensive component in the original (bridge-chart math) — don't rebuild anything equivalent to it.
3. **Header has no filters.** The Entity multi-select, Quarter multi-select, and Currency dropdown are all cut. The header is a static title plus a read-only one-line data-status subtitle — informational only, not a control panel.
4. **KPI strip is 4 cards, not 6** — Revenue, Gross Margin, EBITDA, Ending Cash only (Headcount and Net Revenue Retention are dropped). Each card is value + vs-Budget line + vs-Prior-Year line only — no inline sparkline, no one-line variance-driver explanation, no click-to-open drill-in drawer. Cards are static display, not clickable. **The strip's grid must be sized for 4 columns, not 6** — the 4 cards need to stretch to fill the full row width and line up with the Heatmap/Risks row and the P&L table below; don't leave two empty column tracks where the dropped cards used to be.
5. **Risks & Opportunities has no metric toggle** — one single fixed list of ~5 items, no interactive filtering. Do not render the Revenue/EBITDA/Cash toggle buttons at all, not even as static/disabled pills.
6. **Heatmap has no dimension toggle** — hardcoded to Region only (Department/Product/Customer Segment breakdowns are dropped). Do not render the Region/Department/Product/Customer Segment toggle buttons at all, not even as static/disabled pills.
7. **P&L grid is a flat static table, not a computed grid** — Account + Forecast + Budget + Prior Year columns only, hardcoded literal values per row. No account hierarchy/parent-child, no expand/collapse, no FY/Monthly toggle, no Variance/Variance%/YoY% columns. Net result: a much simpler frame than the original — static header, 4 static KPI cards, one static risks list, one static heatmap, one static flat P&L table. Almost nothing is interactive (hover tooltips are fine if cheap; nothing should be clickable/filterable beyond that). **If I said "made-up demo numbers" in Question 2 and the tool is still basically this cockpit idea** (i.e. I didn't redirect it to something substantially different in Question 1), use this exact dataset verbatim instead of inventing your own — every figure below is extracted as-is from the original cockpit's authored FY26 dataset, so it's already internally consistent and doesn't need tuning: ```js
// All monetary figures are in EUR millions unless noted. FY totals — the
// layered Forecast is actuals through August, plan for Sep-Dec.
var KPIS = [ { id: 'revenue', label: 'Revenue', format: 'currency', forecast: 191.4, budget: 195.5, priorYear: 178.2 }, { id: 'grossMargin', label: 'Gross Margin', format: 'percentage', forecast: 74.2, budget: 73.1, priorYear: 72.0 }, { id: 'ebitda', label: 'EBITDA', format: 'currency', forecast: 31.8, budget: 31.2, priorYear: 27.5 }, { id: 'cash', label: 'Ending Cash', format: 'currency', forecast: 68.5, budget: 65.1, priorYear: 61.0 }
];
// variance = forecast - budget; favorable if variance >= 0 for all four (none inverted).
// variancePct = variance / budget * 100 (omit for the two % metrics; show the point delta instead). var ACTUAL_MONTHS = 8; // Jan-Aug actual, Sep-Dec forecast — drives the header subtitle/tag only.
var HEADER_SUBTITLE = 'Actuals through August, Forecast through December';
var HEADER_TAG = 'Actuals + Forecast'; // the resolved state for this fixed window (would be 'Actuals' before the switchover, 'Forecast' after FY close) // Risks & Opportunities — fixed list, no filtering.
var RISKS_OPPORTUNITIES = [ { id: 'r1', kind: 'risk', label: 'EMEA renewal delays', grossImpact: -3.6, probability: 0.85, weightedImpact: -3.06, metric: 'revenue', owner: 'M. Laurent · EMEA RVP', timing: 'Q4 FY26', entity: 'EMEA', includedInForecast: true }, { id: 'r2', kind: 'opportunity', label: 'Cloud infrastructure savings', grossImpact: 1.4, probability: 0.9, weightedImpact: 1.26, metric: 'ebitda', owner: 'T. Okafor · VP Engineering', timing: 'Q3–Q4 FY26', entity: 'group', includedInForecast: true }, { id: 'r3', kind: 'opportunity', label: 'APAC enterprise deal', grossImpact: 2.8, probability: 0.4, weightedImpact: 1.12, metric: 'revenue', owner: 'S. Tanaka · APAC RVP', timing: 'Q4 FY26', entity: 'APAC', includedInForecast: false }, { id: 'r4', kind: 'opportunity', label: 'Hiring delays / cost timing', grossImpact: 1.8, probability: 0.75, weightedImpact: 1.35, metric: 'ebitda', owner: 'R. Chen · CHRO', timing: 'Q3–Q4 FY26', entity: 'group', includedInForecast: true }, { id: 'r5', kind: 'risk', label: 'FX exposure', grossImpact: -2.2, probability: 0.5, weightedImpact: -1.1, metric: 'cash', owner: 'J. Meyer · Treasury', timing: 'Q4 FY26', entity: 'group', includedInForecast: false }
];
// weightedImpact = grossImpact * probability (already computed above — don't re-derive).
// Impact bar width: scale by |weightedImpact| relative to the max |weightedImpact| across all 5 rows.
// "region tag" = entity ('group' renders as "Group", not attributable to one region). // Performance heatmap — hardcoded to Region (no dimension toggle). Rows = KPI,
// columns = the 3 regions. Cells shaded by favorability of forecast vs budget.
var HEATMAP = { categories: ['North America', 'EMEA', 'APAC'], revenue: { budget: [87.975, 68.425, 39.1], forecast: [88.975, 62.925, 39.5] }, ebitda: { budget: [15.6, 9.8, 5.8], forecast: [16.3, 8.8, 6.7] }, grossMarginPct: { budget: [74.0, 72.5, 74.5], forecast: [75.0, 71.0, 76.0] }
};
// favorable if forecast >= budget for revenue/ebitda/grossMarginPct (none inverted here).
// Shade cells by direction (favorable/unfavorable), not by magnitude gradient — remember the
// "ambient glass" rule below: favorability is carried by glyph/hatch, never by hue. // P&L — flat static reference table, no hierarchy, no computed columns. Values
// are the real authored FY26 figures (EUR millions); render exactly as given.
var PNL_ROWS = [ { label: 'Subscription revenue', forecast: 162.0, budget: 165.0, priorYear: 148.5 }, { label: 'Services revenue', forecast: 29.4, budget: 30.5, priorYear: 29.7 }, { label: 'Hosting and infrastructure', forecast: 24.00, budget: 29.00, priorYear: 27.0 }, { label: 'Customer support', forecast: 13.80, budget: 14.00, priorYear: 13.5 }, { label: 'Professional services delivery', forecast: 11.58, budget: 9.58, priorYear: 9.0 }, { label: 'Gross profit', forecast: 142.02, budget: 142.92, priorYear: 128.70 }, { label: 'Sales & Marketing', forecast: 57.90, budget: 61.50, priorYear: 56.2 }, { label: 'Research & Development', forecast: 33.90, budget: 33.50, priorYear: 29.0 }, { label: 'General & Administrative', forecast: 18.42, budget: 16.72, priorYear: 16.0 }, { label: 'EBITDA', forecast: 31.80, budget: 31.20, priorYear: 27.50 }, { label: 'Depreciation & amortization', forecast: 8.70, budget: 8.50, priorYear: 7.90 }, { label: 'Operating income', forecast: 23.10, budget: 22.70, priorYear: 19.60 }, { label: 'Net financial result', forecast: 0.90, budget: 1.20, priorYear: 1.50 }, { label: 'Pre-tax income', forecast: 22.20, budget: 21.50, priorYear: 18.10 }
];
// These are literal hardcoded values per row (Gross profit / EBITDA / Operating income /
// Pre-tax income are shown as plain rows here too, NOT computed rollups — just display
// their literal numbers above like every other row). Trust every number here and above —
// don't re-derive or invent your own, and don't hand-check them against anything before
// moving on; that verification has already been done once and doesn't need repeating.
```
If instead Question 1 redirected this to a meaningfully different tool, or Question 2 pointed to real Pigment data, this dataset doesn't apply — build whatever the real answers call for. ## Visual style — "ambient glass" theme
Use these exact tokens and rules for the build, regardless of what the final data/use-case turns out to be. This visual language is unchanged by the scope cuts above. **Background scene**: a single full-bleed background painted once per viewport size as a canvas raster (not per-frame) — an "azure noon" composition: a bright saturated azure field, darkest in the top-right, one elongated tilted silver-white bloom low-left with a haze tail up the left edge, a coral-peach light leak braided into the bottom-left fog, and faint diagonal wave striations from seeded noise. **Glass panels**: every panel is a simple translucent dark glass slab over that scene — one flat `rgba(black, ~0.4)` fill, no borders, no per-panel gradients, no `backdrop-filter` (layered blur causes visible tile seams on some GPUs, which is why the source deliberately avoids it). **Text system**: all text and UI chrome is white at varying opacity only — no hue anywhere. Primary text ~95% white, secondary ~62%, tertiary ~40%, whisper/disabled ~28%, hairlines ~6–16% white. **Favorability rule — no color coding**: favorable/unfavorable states are carried entirely by ▲/▼ glyphs and +/− signs plus a diagonal white hatch pattern for "unfavorable" fills (e.g. `repeating-linear-gradient(135deg, rgba(255,255,255,0.92) 0px, rgba(255,255,255,0.92) 2px, rgba(255,255,255,0.16) 2px, rgba(255,255,255,0.16) 5px)`) — never a color. Apply this to the KPI variance lines, the risks impact bars, and the heatmap cell shading alike. **Fonts**: since this environment cannot embed or fetch custom web fonts, use system font stacks only — sans: `-apple-system, BlinkMacSystemFont, "Helvetica Neue", Arial, sans-serif` for all headings/body text; mono: `SFMono-Regular, Menlo, Consolas, monospace` for small metadata labels (section numbers, timestamps, tags). Do not attempt to load Instrument Sans/IBM Plex Mono or any other named font. **Design tokens — exact values, machine-readable**:
```js
var T = { ink: 'rgba(255,255,255,0.95)', // primary text ink2: 'rgba(255,255,255,0.62)', // secondary text ink3: 'rgba(255,255,255,0.40)', // tertiary / disabled text ink4: 'rgba(255,255,255,0.28)', // whisper text hairline: 'rgba(255,255,255,0.10)', hairlineSoft: 'rgba(255,255,255,0.06)', hairlineStrong: 'rgba(255,255,255,0.16)', fillFaint: 'rgba(255,255,255,0.04)', fillSoft: 'rgba(255,255,255,0.07)', veil: 'rgba(3,16,19,0.45)', // dark = scene shadow, not a color deep: '#0E3355', // darkest azure (text on white pills) sceneBase: '#2B6C9F', backdrop: 'rgba(8,30,52,0.30)', hatch: 'repeating-linear-gradient(135deg, rgba(255,255,255,0.92) 0px, rgba(255,255,255,0.92) 2px, rgba(255,255,255,0.16) 2px, rgba(255,255,255,0.16) 5px)'
};
var FONT_SANS = '-apple-system, BlinkMacSystemFont, "Helvetica Neue", Arial, sans-serif';
var FONT_MONO = 'SFMono-Regular, Menlo, Consolas, monospace';
``` **Icons**: the source's hand-drawn SVG markup is generic UI chrome (chevrons for expand/collapse, close, share, arrows, an inbox empty-state glyph, an alert triangle, a sparkle) — none of it is domain-specific to the panels kept in this scope, and the two icons tied to cut features (chevronDown/chevronRight, used only for P&L expand/collapse) don't apply anymore since the P&L is now a flat table. If you want a small glyph for the risk/opportunity kind tags or the region tag, a plain ▲/▼ or a one-character glyph is sufficient — no need to invent new SVG iconography for this build. **Layout — no leftover gap from the cut Forecast Landing panel:** header, then KPI strip (full-width), then **Performance Heatmap and Risks & Opportunities side by side in one row — Heatmap on the left at flex 7, Risks on the right at flex 5** (a ~58/42 split; this is the exact ratio the original design already used for Forecast Landing + Risks, just with the Heatmap dropped into Forecast Landing's old spot), then the P&L table full-width below. Do not stack Heatmap and Risks as two separate full-width rows — in the original 7-panel design Risks sat next to Forecast Landing, which is cut here, so putting Risks alone in a full-width row would leave a large empty gap next to it. Pairing it with the Heatmap instead fills that row properly, and reusing the original flex-7/flex-5 split (rather than inventing a new ratio) is what keeps both panels comfortably sized — the Heatmap needs the wider side since it has 4 data columns, Risks needs less since it's just a list. ## Quality bar
No console errors. Keep every panel — header status line, KPI strip, risks list, heatmap, and P&L table — deriving from the same underlying FY totals (e.g. the KPI card values and the P&L Revenue/EBITDA rows must agree) so nothing contradicts on screen. Clean up all listeners/timers/DOM the frame added when re-mounted.
```
**1. **Download this image. Attach it to the Modeler Agent chat to guide the Frame’s design.****
[](https://cdn.document360.io/e47cfe35-dc28-40c7-a083-6cf003073d8e/Images/Documentation/performance.png?sv=2026-02-06&spr=https&st=2026-11-12T18%3A12%3A12Z&se=2026-11-12T19%3A12%3A12Z&sr=c&sp=r&sig=N8HVBRiLTgrS3xRvrjdXXURBiz%2FFNLUzMoP1av4dK90%3D)performance515.38 KB[](https://cdn.document360.io/e47cfe35-dc28-40c7-a083-6cf003073d8e/Images/Documentation/performance.png?sv=2026-02-06&spr=https&st=2026-11-12T18%3A12%3A12Z&se=2026-11-12T19%3A12%3A12Z&sr=c&sp=r&sig=N8HVBRiLTgrS3xRvrjdXXURBiz%2FFNLUzMoP1av4dK90%3D)
**Transactional opex planner**
**Explore a marketing expense manager built in Pigment. Add, edit, and delete OPEX line items and watch monthly spend, category mix, and budget variance update live.** [**See it in action**](https://www.pigment.com/hall-of-frames/transactional-opex-planner)**.**
.png?sv=2026-02-06&spr=https&st=2026-11-12T18%3A12%3A12Z&se=2026-11-12T19%3A12%3A12Z&sr=c&sp=r&sig=N8HVBRiLTgrS3xRvrjdXXURBiz%2FFNLUzMoP1av4dK90%3D)
**What to do:**
**1. **Open and copy the prompt for this Frame. Paste it into the Modeler Agent chat.****
```ModelerAgentprompt
Before building anything, ask me a few quick questions — one at a time, wait for my answer before asking the next one. Don't write any code or create anything until we're through all of them. Use the AskUser card to ask each question. **Question 1**: The attached screenshot is a marketing OPEX dashboard — a KPI row (budget/spend/forecast), a monthly spend chart, a category breakdown, a Committed-vs-Planned radar, and an editable expense table with an Add/Edit modal. Ask me simply: *"Does this use case match your intent, or were you picturing something a bit different?"* If I say something different, ask me to describe it in a sentence or two and go with that instead of the screenshot's version. **Question 2**: Ask me: *"Should I use made-up demo numbers for now, or hook this up to real data you already have in Pigment?"* **Question 3** (only if I said "real data" in Question 2): Ask me: *"Which List, Metric, or Table should it use?"* Wait for me to name it — don't guess or invent names. **Question 4** (only if I said "made-up demo numbers" in Question 2): Ask me: *"Want me to just fake it for now, or actually set up real Lists/Metrics for this later?"* If I want it set up for real, ask where (which Application/folder) before creating anything. **Then build it.** Tell me first that building the frame can take up to 10 minutes. Use my answers for what the tool actually does and where its data comes from. For the *look* — colors, card layout, fonts, spacing — match the attached screenshot's style exactly, regardless of what we land on for Questions 1–4. **If I said "made-up demo numbers" in Question 2 and the tool is still basically this OPEX-dashboard idea** (i.e. I didn't redirect it to something substantially different in Question 1), use this exact dataset verbatim instead of inventing your own — it's already internally consistent and screenshot-accurate, so there's no need to make up or tune numbers: ```js
var CATEGORIES = [ 'Campaigns & paid media', 'Events & sponsorships', 'Agencies & contractors', 'Software & tools', 'Content & creative production', 'Customer research', 'Travel & entertainment'
];
var CATEGORY_SHORT = ['Campaigns', 'Events', 'Agencies', 'Software', 'Content', 'Research', 'Travel'];
var ANNUAL_BUDGET = 4000; // thousands EUR var MOCK_EXPENSES = [ { name: 'Paid media program', category: 'Campaigns & paid media', annualForecast: 1050, allocation: 'even', startMonth: 1, endMonth: 12, status: 'committed' }, { name: 'Customer conference', category: 'Events & sponsorships', annualForecast: 480, allocation: 'onetime', startMonth: 10, endMonth: 10, status: 'committed' }, { name: 'Creative agency retainer', category: 'Agencies & contractors', annualForecast: 620, allocation: 'even', startMonth: 1, endMonth: 12, status: 'committed' }, { name: 'Marketing automation platform', category: 'Software & tools', annualForecast: 310, allocation: 'even', startMonth: 1, endMonth: 12, status: 'committed' }, { name: 'Analytics and attribution tools', category: 'Software & tools', annualForecast: 120, allocation: 'even', startMonth: 1, endMonth: 12, status: 'committed' }, { name: 'Content production program', category: 'Content & creative production', annualForecast: 410, allocation: 'even', startMonth: 3, endMonth: 12, status: 'planned' }, { name: 'Brand research program', category: 'Customer research', annualForecast: 220, allocation: 'onetime', startMonth: 6, endMonth: 6, status: 'committed' }, { name: 'Travel and team events', category: 'Travel & entertainment', annualForecast: 340, allocation: 'even', startMonth: 1, endMonth: 12, status: 'planned' }
]; var MOCK_MONTHLY = [ { month: 1, value: 230, scenario: 'actual', budget: 300 }, { month: 2, value: 240, scenario: 'actual', budget: 300 }, { month: 3, value: 270, scenario: 'actual', budget: 320 }, { month: 4, value: 280, scenario: 'actual', budget: 320 }, { month: 5, value: 300, scenario: 'actual', budget: 330 }, { month: 6, value: 310, scenario: 'actual', budget: 340 }, { month: 7, value: 330, scenario: 'actual', budget: 350 }, { month: 8, value: 340, scenario: 'actual', budget: 350 }, { month: 9, value: 330, scenario: 'forecast', budget: 350 }, { month: 10, value: 360, scenario: 'forecast', budget: 360 }, { month: 11, value: 300, scenario: 'forecast', budget: 340 }, { month: 12, value: 260, scenario: 'forecast', budget: 340 }
];
// Each expense's annual amount lands on months per its allocation rule (one-time → full amount on
// startMonth only; even → split equally across every month from startMonth to endMonth inclusive).
// Spent to Date sums actualized months; Full-Year Forecast sums every expense's annual amount;
// Remaining Budget = ANNUAL_BUDGET - Full-Year Forecast. The radar's two series are each expense's
// annual amount summed per category, split by status (committed vs planned).
// Trust these numbers and formulas as-is — don't re-derive or invent your own.
```
If instead Question 1 redirected this to a meaningfully different tool, or Question 2 pointed to real Pigment data, this dataset doesn't apply — build whatever the real answers call for. ## Visual style — light, clean SaaS theme
Use these exact tokens for the build, regardless of what the final data/use-case turns out to be. **Fonts**: system stacks only — `-apple-system, BlinkMacSystemFont, "Helvetica Neue", Arial, sans-serif`. Do not attempt to fetch or embed any custom web font (no network access in this environment). **Icons** — use this exact SVG markup verbatim, do not redraw (hand-tuned 16×16 outline icons, 12×12 for the chevron; `currentColor` inherits each usage's icon color):
```html
``` **Design tokens** — exact values, machine-readable:
```js
var TOKENS = { colors: { white: '#FFFFFF', grey10: '#F7F7F8', grey20: '#E8EAED', grey30: '#949FB2', grey50: '#5A657A', grey90: '#020D23', cardBorder: 'rgba(2,13,35,0.08)', hoverFill: 'rgba(2,13,35,0.04)', primary10: '#F0F5FF', primary20: '#95B9FF', primary30: '#2684FF', primary50: '#0355F3', primary90: '#0038A4', primaryLightTransparent: 'rgba(3,85,243,0.05)', negative50: '#D02B41', negative10: '#FFF0F2', negative90: '#740C19', category: ['hsl(219,98%,48%)', 'hsl(147,99%,33%)', 'hsl(259,100%,77%)', 'hsl(36,100%,55%)', 'hsl(185,100%,34%)', 'hsl(345,87%,63%)', 'hsl(43,100%,48%)'], // cycle in order, 1 per category focusRing: '0 0 0 3px rgba(149,185,255,1)' // primary20 }, // role: [size, weight, lineHeight, color] type: { pageTitle: ['24px', 500, '32px', 'grey90'], pageSubtitle: ['14px', 400, '20px', 'grey50'], sectionTitle: ['16px', 600, '24px', 'grey90'], kpiLabel: ['11px', 400, '16px', 'grey50'], // uppercase kpiValue: ['28px', 500, '36px', 'grey90-or-negative50'], tableColumnHeader: ['11px', 400, '16px', 'grey50'], // uppercase tableCellOrFieldLabel: ['14px', 500, '20px', 'grey90'], categoryRowFigures: ['12px', 400, '16px', 'grey50'] }, radius: { xs: '4px', sm: '6px' }, // xs = cards/buttons/inputs, sm = modal panel only (the one real drop shadow at rest) components: { button: '32px tall, 4px radius, no visible border — primary: solid primary50/white, hover primary90; secondary/ghost: primaryLightTransparent or transparent with primary50 text', input: '32px tall, 4px radius, white bg, grey20 inset border, focus -> primary30 border + focusRing', chip: 'fully rounded (9999px), 20px tall, 12px text, no border', card: 'flat, 1px cardBorder, no shadow at rest, soft shadow on hover' }
};
``` ## Quality bar
No console errors. Whatever data source we land on, keep every panel deriving from the same underlying values so nothing contradicts on screen. Clean up all listeners/timers/DOM the frame added when re-mounted.
```
**1. **Download this image. Attach it to the Modeler Agent chat to guide the Frame’s design.****
[](https://cdn.document360.io/e47cfe35-dc28-40c7-a083-6cf003073d8e/Images/Documentation/opex.png?sv=2026-02-06&spr=https&st=2026-11-12T18%3A12%3A12Z&se=2026-11-12T19%3A12%3A12Z&sr=c&sp=r&sig=N8HVBRiLTgrS3xRvrjdXXURBiz%2FFNLUzMoP1av4dK90%3D)opex108.94 KB[](https://cdn.document360.io/e47cfe35-dc28-40c7-a083-6cf003073d8e/Images/Documentation/opex.png?sv=2026-02-06&spr=https&st=2026-11-12T18%3A12%3A12Z&se=2026-11-12T19%3A12%3A12Z&sr=c&sp=r&sig=N8HVBRiLTgrS3xRvrjdXXURBiz%2FFNLUzMoP1av4dK90%3D)
**Slide deck**
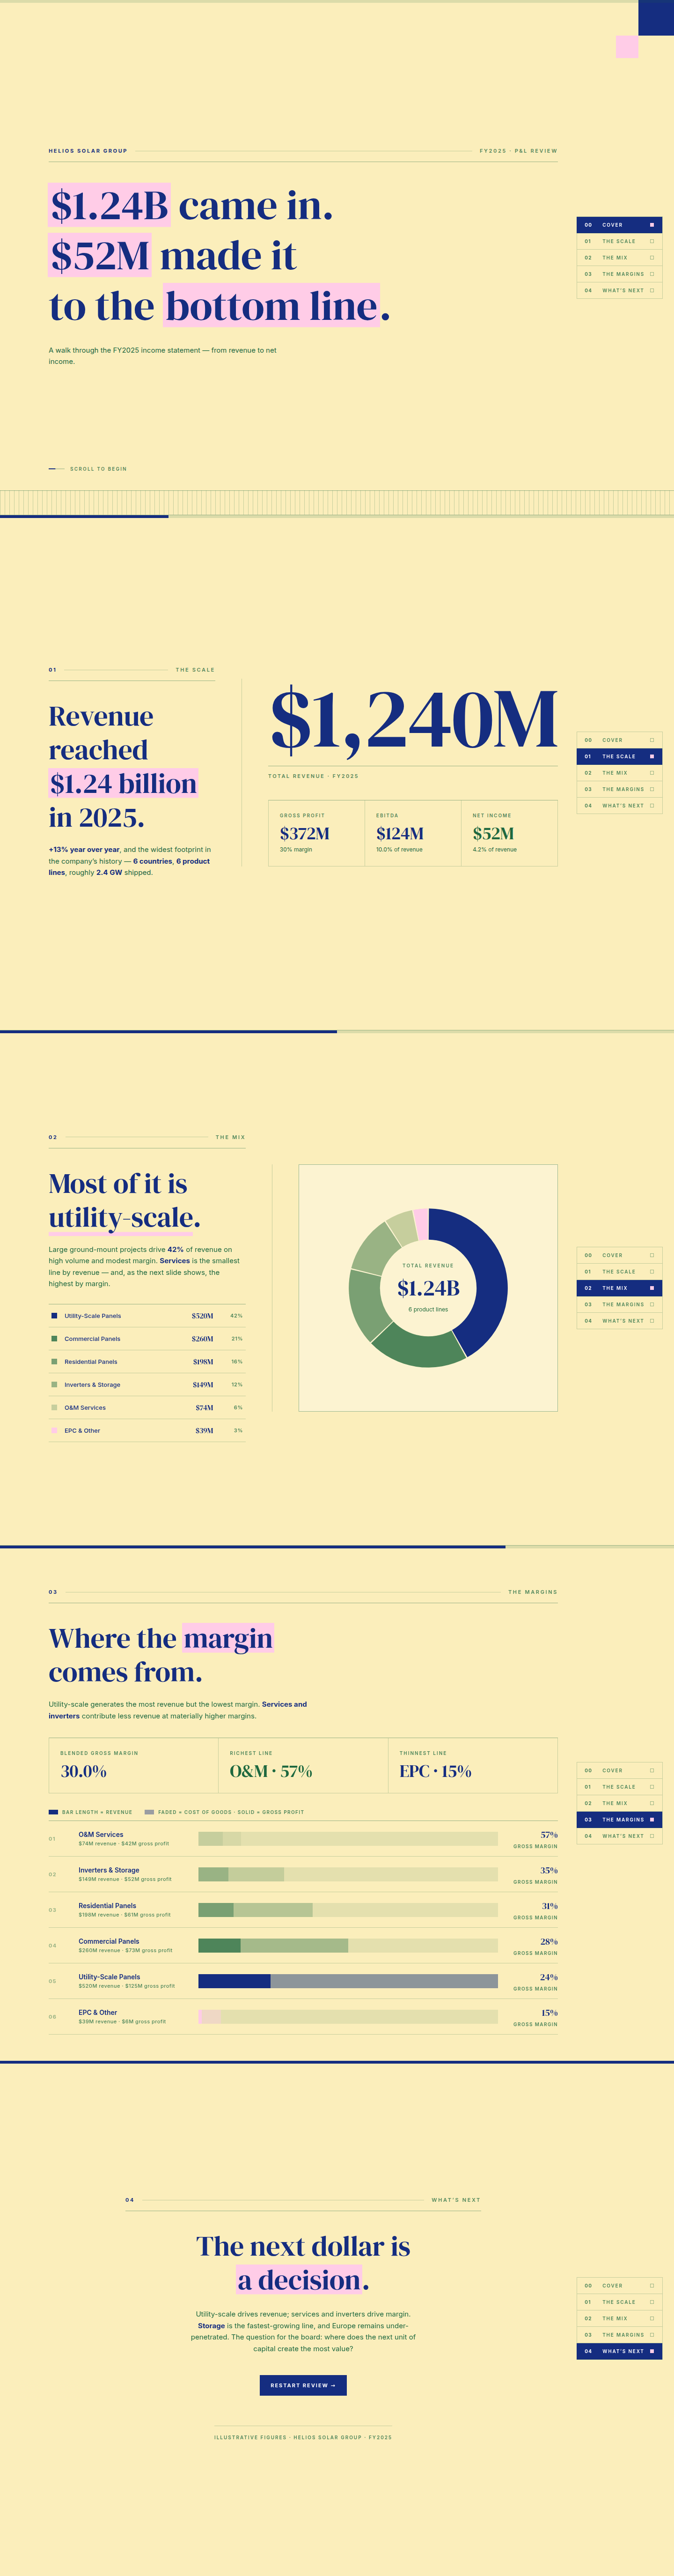
**Explore a P&L story deck built in Pigment. Scroll through FY2025 revenue, margin, and geographic mix as a guided narrative, from the topline down to net income.** [**See it in action**](https://www.pigment.com/hall-of-frames/slide-deck)**.**
**What to do:**
**1. **Open and copy the prompt for this Frame. Paste it into the Modeler Agent chat.****
```ModelerAgentprompt
Before building anything, ask me a few quick questions — one at a time, wait for my answer before asking the next one. Don't write any code or create anything until we're through all of them. Use the AskUser card to ask each question. **Question 1**: The attached screenshot is a scroll-driven annual P&L review deck — a cover slide, then three story slides you scroll through in order: "The Scale" (headline revenue/gross-profit/EBITDA/net-income figures), "The Mix" (a donut of revenue by product line with a hover-linked legend), and "The Margins" (a ranked list of product lines by gross margin) — closing on a "What's Next" slide. A fixed side index and a top progress bar track scroll position throughout. Ask me simply: *"Does this use case match your intent, or were you picturing something a bit different?"* If I say something different, ask me to describe it in a sentence or two and go with that instead of the screenshot's version. **Question 2**: Ask me: *"Should I use made-up demo numbers for now, or hook this up to real data you already have in Pigment?"* **Question 3** (only if I said "real data" in Question 2): Ask me: *"Which List, Metric, or Table should it use?"* Wait for me to name it — don't guess or invent names. **Question 4** (only if I said "made-up demo numbers" in Question 2): Ask me: *"Want me to just fake it for now, or actually set up real Lists/Metrics for this later?"* If I want it set up for real, ask where (which Application/folder) before creating anything. **Then build it.** Tell me first that building the frame can take up to 10 minutes. Before writing any code, open and actually look at the attached screenshot — every slide, not just the cover. Skipping this step is the single biggest cause of a wrong build (and a wrong build is far slower to fix than reading the image once up front). Use my answers for what the tool actually does and where its data comes from. For the *look* — colors, panel layout, fonts, spacing — match the attached screenshot's style exactly, regardless of what we land on for Questions 1–4. **The screenshot may show a mid-edit or scrolled state, not necessarily every slide at once** — don't try to match any one frame of it pixel-for-pixel if a slide below is described differently; the slide descriptions and dataset here are the source of truth for scope, the screenshot is the source of truth for visual style only. **Deliberate scope cuts versus the original design** (this deck was originally a longer, more elaborate build; this version keeps the simplest, cheapest slides and drops the two most expensive charts entirely):
1. **"The Ledger" slide is gone entirely.** No revenue-to-net-income waterfall/bridge chart, no connector lines, nothing tied to the P&L walk. This was the single most expensive component in the original (custom bridge-chart math) — don't rebuild anything equivalent to it.
2. **"The Map" slide is gone entirely.** No treemap, no country/region breakdown, no click-to-drill interaction. This was the other most expensive component (a custom squarified-treemap layout algorithm) — don't rebuild anything equivalent to it.
3. **No scroll-triggered reveal animations, and no animated number count-ups.** Every slide's text, big numbers, and charts render fully in place as soon as you scroll to them — nothing fades/slides in, and headline figures (like "$1.24B") display their final value immediately rather than counting up.
4. **The fixed side index and top progress bar stay** — they're cheap (just scroll-position tracking + a jump-to-slide click handler) and they're what makes this read as a deck rather than a plain scrolling page. The side index lists exactly the 5 slides below, in order, and highlights whichever one is currently in view; clicking one jumps to it. The top progress bar fills left-to-right as you scroll through the whole deck.
5. **The Margins slide has no sort toggle.** Drop the Margin/Revenue/A→Z buttons entirely — always show the product lines sorted by gross margin descending (richest margin first), which is the order that best supports this slide's point.
6. **The donut (Mix slide) keeps its hover interaction** — hovering a segment or its matching legend row highlights that segment and swaps the center label to that product's figures. This is cheap (it's just an opacity toggle + text swap) and it's the deck's best interactive moment, so it stays.
7. **The restart button on the closing slide stays** — it's a one-line scroll-to-top action, effectively free. Net result: a 5-slide scrollable deck — Cover, The Scale, The Mix, The Margins, What's Next — with the fixed side nav and progress bar intact, a donut with a working hover, and a ranked bar-list. No waterfall, no treemap, no reveal choreography, no count-up animations, no sort toggle. **If I said "made-up demo numbers" in Question 2 and the tool is still basically this P&L review idea** (i.e. I didn't redirect it to something substantially different in Question 1), use this exact dataset verbatim instead of inventing your own — every figure below is extracted as-is from the original deck's authored FY2025 dataset, so it's already internally consistent and doesn't need tuning: ```js
// All monetary figures are in USD millions. // Headline totals for the Scale slide — must agree with the PRODUCTS sum below.
var TOTALS = { revenue: 1240, grossProfit: 372, grossMarginPct: 30, ebitda: 124, ebitdaPct: 10.0, netIncome: 52, netIncomePct: 4.2, yoyGrowthPct: 13, countries: 6, productLines: 6, gwShipped: 2.4
}; // Revenue by product line — drives both the Mix donut and the Margins list.
// margin is gross margin %; gross profit = rev * margin / 100 (don't re-derive, just display).
var PRODUCTS = [ { key: 'utility', name: 'Utility-Scale Panels', rev: 520, margin: 24 }, { key: 'commercial', name: 'Commercial Panels', rev: 260, margin: 28 }, { key: 'residential', name: 'Residential Panels', rev: 198, margin: 31 }, { key: 'inverter', name: 'Inverters & Storage', rev: 149, margin: 35 }, { key: 'om', name: 'O&M Services', rev: 74, margin: 57 }, { key: 'epc', name: 'EPC & Other', rev: 39, margin: 15 }
];
// TOTAL revenue = 1240 (sum of the above) — must equal TOTALS.revenue.
// Trust every number above — don't re-derive or invent your own, and don't
// hand-check them against anything before moving on; that verification has
// already been done once and doesn't need repeating.
```
If instead Question 1 redirected this to a meaningfully different tool, or Question 2 pointed to real Pigment data, this dataset doesn't apply — build whatever the real answers call for. ## Visual style — "editorial print" theme
Use these exact tokens and rules for the build, regardless of what the final data/use-case turns out to be. This visual language is unchanged by the scope cuts above. **Overall feel**: a large-format print/editorial layout — a flat pale field, oversized serif headlines, a strict grid, thin hairline rule dividers, and bordered panels that sit flush against each other with zero gaps and zero corner radius. Nothing floats on a shadow; everything is bordered, flat, and grid-aligned like a printed report. **Fonts**: since this environment cannot embed or fetch custom web fonts, use system stacks only — serif display: `Georgia, "Times New Roman", serif` for the large headline/big-number treatment (in place of the original's DM Serif Display); sans: `-apple-system, BlinkMacSystemFont, "Helvetica Neue", Arial, sans-serif` for everything else (body text, labels, buttons, nav). Do not attempt to load DM Serif Display, Inter, or any other named font. **Design tokens — exact values, machine-readable**:
```js
var C = { paper: '#FBEEBB', // page field panel: 'rgba(255,255,255,.32)', // translucent panel fill over the field ink: '#152D80', // primary navy ink (headlines, borders, buttons) ink70: '#1D683F', // secondary ink (body copy) — green, not navy ink50: 'rgba(29,104,63,.78)', // tertiary / eyebrow labels ink35: 'rgba(29,104,63,.44)', // faint labels line: 'rgba(29,104,63,.24)', // lightest hairline rule: 'rgba(29,104,63,.44)', // standard hairline / border accent: '#FFCCE7', // pink highlight (headline mark, EPC product color) // product-line ramp (also the donut/margins-bar colors) — flattened solid hexes, not raw opacity utility: '#152D80', commercial: '#4E855A', residential: '#7AA073', inverter: '#99B384', om: '#C6CE9D', epc: '#FFCCE7', pos: '#1D683F' // favorable figures
};
``` **Headline mark style**: key phrases in headlines (e.g. "$1.24B", "40%") get a `` treatment — a solid pink (`accent`) highlight band behind the text only (not a full-width block), like a highlighter stroke: `background-image: linear-gradient(accent, accent); background-repeat: no-repeat; background-size: 100% 1.06em; background-position: 0 center;` with small horizontal padding so the highlight doesn't touch adjacent characters. **Panels & borders**: every panel (`.panel`) is `background: panel` (translucent white over the paper field) with a single `1px solid rule` border — no shadow, no radius. Where multiple cells sit in a grid (KPI cell row, margins list rows), borders are shared/collapsed between adjacent cells so dividers read as one continuous hairline grid, not doubled-up borders. **Cover slide decoration**: a solid navy (`ink`) square (76×76px) pinned to the top-right corner, with a smaller solid pink (`accent`) square (48×48px) offset just below-left of it; a repeating-hairline "stripe" band along the bottom edge (`repeating-linear-gradient(90deg, line 0 1px, transparent 1px 10px)`). **Chart colors**: the donut segments and the Margins bar fills use the same six product-line colors above — keep the mapping identical across both so a reader can carry color associations between slides (e.g. Utility-Scale is always navy `ink`, O&M Services is always `om`). **Layout**: one full-viewport-height slide (``) per story beat, scrolled through vertically — Cover, The Scale, The Mix, The Margins, What's Next, in that order. A fixed top progress bar reflects scroll position; a fixed right-side vertical index lists all 5 slides and jumps to one on click, highlighting whichever slide is currently in view. Two-column slides (Scale, Mix) use a text column plus a visual column, roughly 44/56 split. ## Quality bar
No console errors. Keep every slide deriving from the same underlying dataset (the Mix donut, the Margins list, and the Scale KPIs must all agree on the same product-line and total-revenue figures). Clean up all listeners/timers/observers/DOM the frame added when re-mounted.
```
**1. **Download this image. Attach it to the Modeler Agent chat to guide the Frame’s design.****
[](https://cdn.document360.io/e47cfe35-dc28-40c7-a083-6cf003073d8e/Images/Documentation/slide_deck(1).png?sv=2026-02-06&spr=https&st=2026-11-12T18%3A12%3A12Z&se=2026-11-12T19%3A12%3A12Z&sr=c&sp=r&sig=N8HVBRiLTgrS3xRvrjdXXURBiz%2FFNLUzMoP1av4dK90%3D)slide_deck128.48 KB[](https://cdn.document360.io/e47cfe35-dc28-40c7-a083-6cf003073d8e/Images/Documentation/slide_deck(1).png?sv=2026-02-06&spr=https&st=2026-11-12T18%3A12%3A12Z&se=2026-11-12T19%3A12%3A12Z&sr=c&sp=r&sig=N8HVBRiLTgrS3xRvrjdXXURBiz%2FFNLUzMoP1av4dK90%3D)
**Sales forecasting**
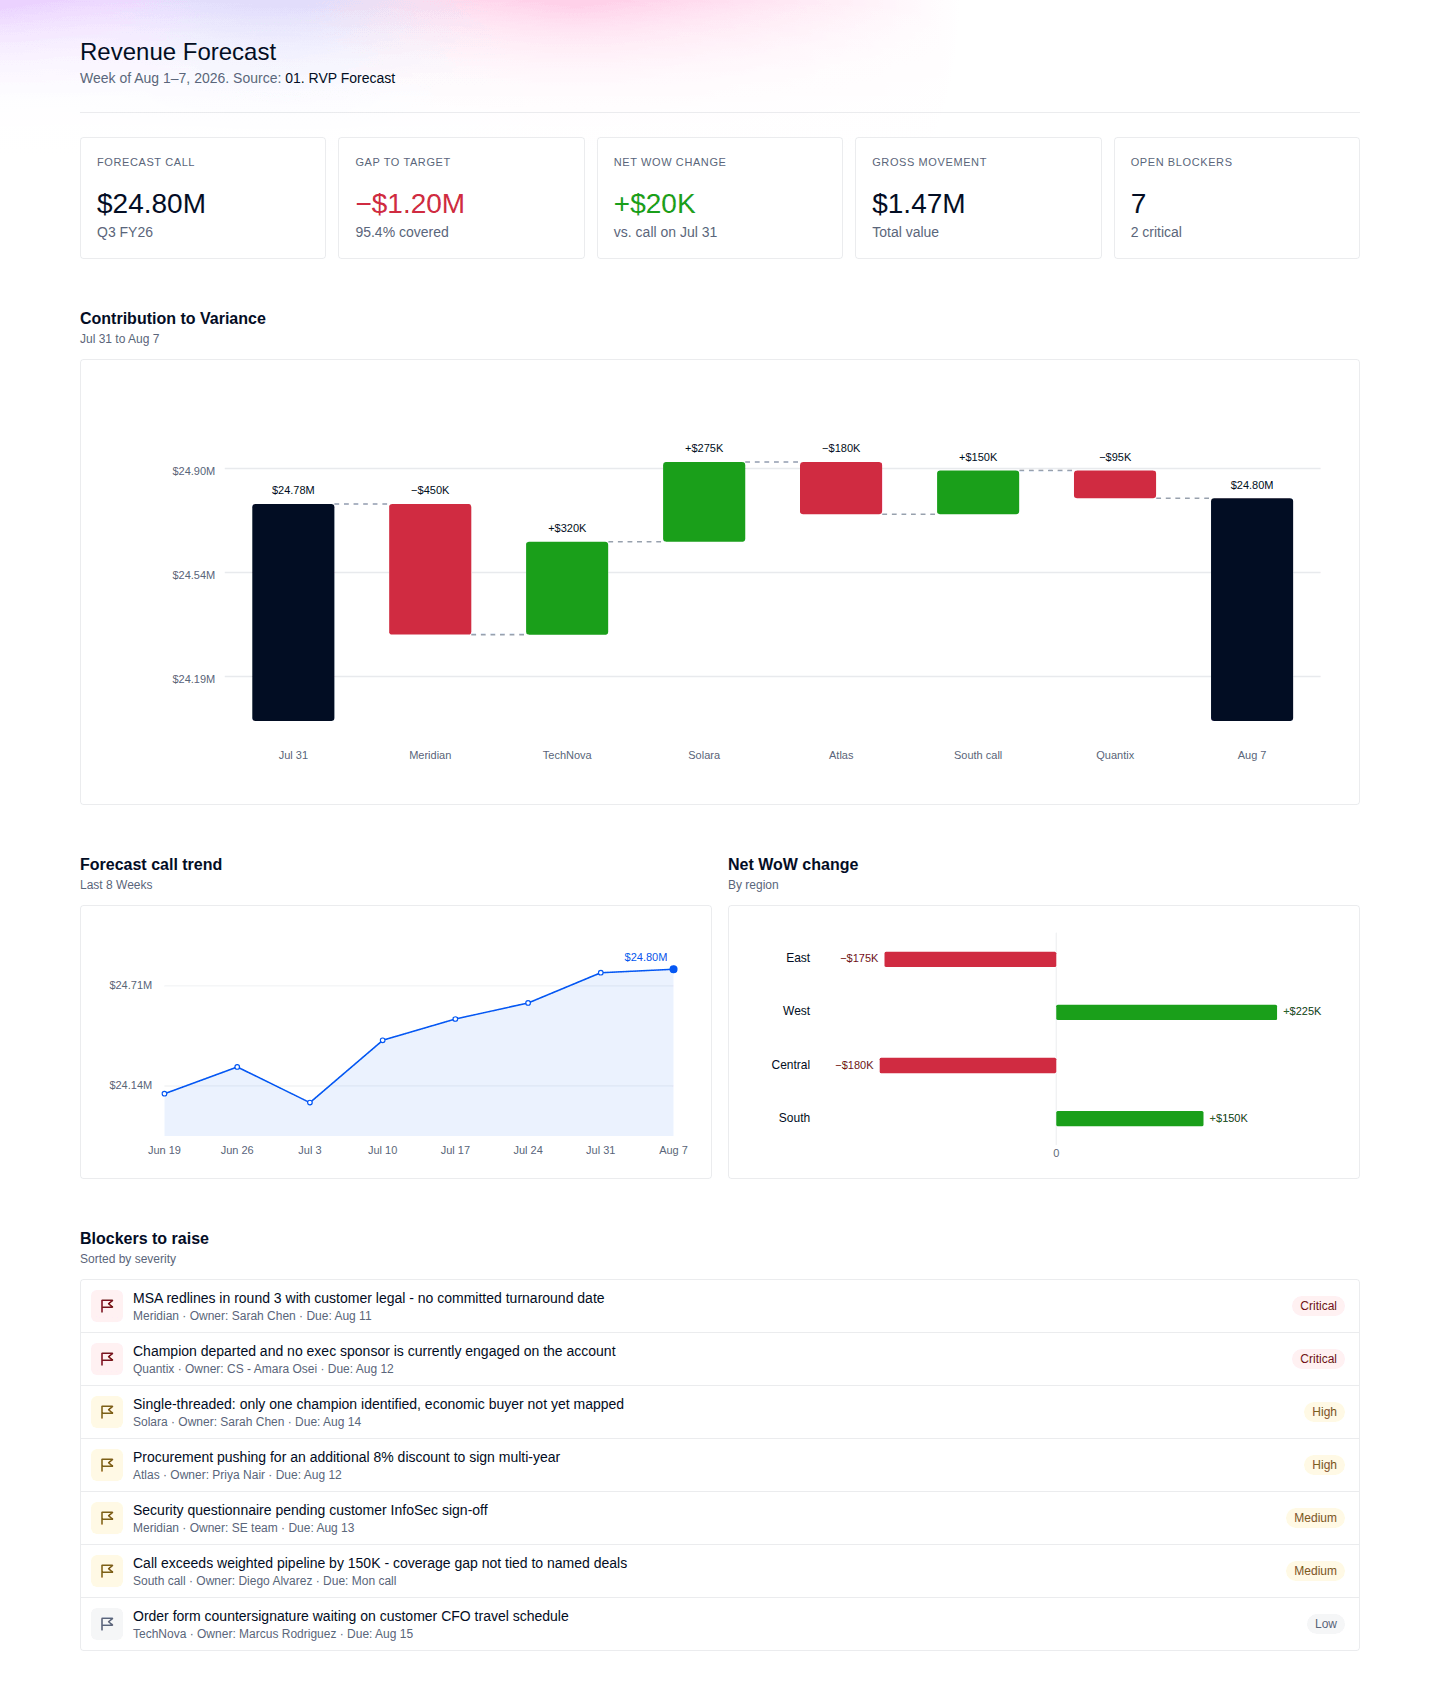
**Explore a revenue forecast Frame built in Pigment. See exactly what moved the weekly call, the blockers behind it, and a scenario for closing the gap to target.** [**See it in action**](https://www.pigment.com/hall-of-frames/sales-forecasting)**.**
**What to do:**
**1. **Open and copy the prompt for this Frame. Paste it into the Modeler Agent chat.****
```ModelerAgentprompt
Before building anything, ask me a few quick questions — one at a time, wait for my answer before asking the next one. Don't write any code or create anything until we're through all of them. Use the AskUser card to ask each question. **Question 1**: The attached screenshot is a weekly sales forecast call review — a KPI row (forecast call, gap to target, net week-over-week change, gross movement, open blockers), a "Contribution to Variance" waterfall walking last week's call to this week's call through each named deal change, a forecast-call trend line (last 8 weeks) and a net-change-by-region bar chart side by side, and a "Blockers to raise" list sorted by severity. Clicking a blocker row opens a detail drawer for that deal — why it changed, before/after value, related blockers, suggested recovery levers, and its own highlighted spot on the waterfall. Ask me simply: *"Does this use case match your intent, or were you picturing something a bit different?"* If I say something different, ask me to describe it in a sentence or two and go with that instead of the screenshot's version. **Question 2**: Ask me: *"Should I use made-up demo numbers for now, or hook this up to real data you already have in Pigment?"* **Question 3** (only if I said "real data" in Question 2): Ask me: *"Which List, Metric, or Table should it use?"* Wait for me to name it — don't guess or invent names. **Question 4** (only if I said "made-up demo numbers" in Question 2): Ask me: *"Want me to just fake it for now, or actually set up real Lists/Metrics for this later?"* If I want it set up for real, ask where (which Application/folder) before creating anything. **Then build it.** Tell me first that building the frame can take up to 10 minutes. Before writing any code, open and actually look at the attached screenshot — every panel. Skipping this step is the single biggest cause of a wrong build (and a wrong build is far slower to fix than reading the image once up front). Use my answers for what the tool actually does and where its data comes from. For the *look*, this one is different from other frames: don't invent a custom visual style — copy the CSS given below verbatim into a single `