⚠️ Important
Frames is available in Beta from September 28, 2026. For more information, see the Beta Features Policy article.
Make it yourself!
Use the prompts and visual cues below in the Modeler Agent to generate Frames in your Application.
Explore an executive performance Frame built in Pigment. Revenue, margin, EBITDA, cash, headcount, and NRR against budget, with forecast ranges, variance drivers, and a full P&L drill-down. See it in action.
(1).png?sv=2026-02-06&spr=https&st=2026-09-28T17%3A42%3A11Z&se=2026-09-28T19%3A31%3A11Z&sr=c&sp=r&sig=3bw3LlPjkB9Azn2gSCZQzNtOfO%2BMt%2FE7vxKlWHKfRlU%3D)
What to do:
Open and copy the prompt for this Frame. Paste it into the Modeler Agent chat.
Open and copy the prompt for this Frame. Paste it into the Modeler Agent chat.
Before building anything, ask me a few quick questions — one at a time, wait for my answer before asking the next one. Don't write any code or create anything until we're through all of them. Use the AskUser card to ask each question. **Question 1**: The attached screenshot is an executive performance cockpit — a static header (title + a one-line data-status subtitle like "Actuals through August, Forecast through December" with an Actuals/Actuals+Forecast/Forecast tag, no filters), a strip of 4 KPI cards (Revenue, Gross Margin, EBITDA, Ending Cash — each just a value, a vs-Budget line, and a vs-Prior-Year line), a risks & opportunities list (~5 items with owner, timing, a probability-weighted impact bar, an in-forecast tag, a region tag), a performance heatmap (KPIs × Region, shaded by favorability), and a flat P&L reference table (Account, Forecast, Budget, Prior Year — no hierarchy, no computed columns). Ask me simply: *"Does this use case match your intent, or were you picturing something a bit different?"* If I say something different, ask me to describe it in a sentence or two and go with that instead of the screenshot's version. **Question 2**: Ask me: *"Should I use made-up demo numbers for now, or hook this up to real data you already have in Pigment?"* **Question 3** (only if I said "real data" in Question 2): Ask me: *"Which List, Metric, or Table should it use?"* Wait for me to name it — don't guess or invent names. **Question 4** (only if I said "made-up demo numbers" in Question 2): Ask me: *"Want me to just fake it for now, or actually set up real Lists/Metrics for this later?"* If I want it set up for real, ask where (which Application/folder) before creating anything. **Then build it.** Tell me first that building the frame can take up to 10 minutes. Before writing any code, open and actually look at the attached screenshot — every panel. Skipping this step is the single biggest cause of a wrong build (and a wrong build is far slower to fix than reading the image once up front). Use my answers for what the tool actually does and where its data comes from. For the *look* — colors, card layout, fonts, spacing — match the attached screenshot's style exactly, regardless of what we land on for Questions 1–4. Write the Frame in one file pass — assemble the full body and write it once (or in 2–3 large passes at most), not as many small incremental edits. The dataset and design tokens below are for you to wire directly into the code; reference them by name in your own response rather than re-pasting the full arrays/objects back — restating them adds length without adding anything I need to review. **The screenshot may show a mid-edit or scrolled state, not necessarily every panel at once** — don't try to match any one frame of it pixel-for-pixel if a panel below is described differently; the panel descriptions and dataset here are the source of truth for scope, the screenshot is the source of truth for visual style only. **Deliberate scope cuts versus the original design** (this cockpit was originally a 7-component build; this version keeps 5 of the simplest, cuts everything expensive or interactive):
1. **Forecast Landing panel is gone entirely** — the 3 range sliders (Revenue/EBITDA/Cash, Downside→Budget→Forecast→Upside with a Prior-Forecast marker) are not part of this build.
2. **Variance waterfall is gone entirely** — no bridge/connector chart, no Metric/Comparison toggles, no 5 named drivers. This was the single most expensive component in the original (bridge-chart math) — don't rebuild anything equivalent to it.
3. **Header has no filters.** The Entity multi-select, Quarter multi-select, and Currency dropdown are all cut. The header is a static title plus a read-only one-line data-status subtitle — informational only, not a control panel.
4. **KPI strip is 4 cards, not 6** — Revenue, Gross Margin, EBITDA, Ending Cash only (Headcount and Net Revenue Retention are dropped). Each card is value + vs-Budget line + vs-Prior-Year line only — no inline sparkline, no one-line variance-driver explanation, no click-to-open drill-in drawer. Cards are static display, not clickable. **The strip's grid must be sized for 4 columns, not 6** — the 4 cards need to stretch to fill the full row width and line up with the Heatmap/Risks row and the P&L table below; don't leave two empty column tracks where the dropped cards used to be.
5. **Risks & Opportunities has no metric toggle** — one single fixed list of ~5 items, no interactive filtering. Do not render the Revenue/EBITDA/Cash toggle buttons at all, not even as static/disabled pills.
6. **Heatmap has no dimension toggle** — hardcoded to Region only (Department/Product/Customer Segment breakdowns are dropped). Do not render the Region/Department/Product/Customer Segment toggle buttons at all, not even as static/disabled pills.
7. **P&L grid is a flat static table, not a computed grid** — Account + Forecast + Budget + Prior Year columns only, hardcoded literal values per row. No account hierarchy/parent-child, no expand/collapse, no FY/Monthly toggle, no Variance/Variance%/YoY% columns. Net result: a much simpler frame than the original — static header, 4 static KPI cards, one static risks list, one static heatmap, one static flat P&L table. Almost nothing is interactive (hover tooltips are fine if cheap; nothing should be clickable/filterable beyond that). **If I said "made-up demo numbers" in Question 2 and the tool is still basically this cockpit idea** (i.e. I didn't redirect it to something substantially different in Question 1), use this exact dataset verbatim instead of inventing your own — every figure below is extracted as-is from the original cockpit's authored FY26 dataset, so it's already internally consistent and doesn't need tuning: ```js
// All monetary figures are in EUR millions unless noted. FY totals — the
// layered Forecast is actuals through August, plan for Sep-Dec.
var KPIS = [ { id: 'revenue', label: 'Revenue', format: 'currency', forecast: 191.4, budget: 195.5, priorYear: 178.2 }, { id: 'grossMargin', label: 'Gross Margin', format: 'percentage', forecast: 74.2, budget: 73.1, priorYear: 72.0 }, { id: 'ebitda', label: 'EBITDA', format: 'currency', forecast: 31.8, budget: 31.2, priorYear: 27.5 }, { id: 'cash', label: 'Ending Cash', format: 'currency', forecast: 68.5, budget: 65.1, priorYear: 61.0 }
];
// variance = forecast - budget; favorable if variance >= 0 for all four (none inverted).
// variancePct = variance / budget * 100 (omit for the two % metrics; show the point delta instead). var ACTUAL_MONTHS = 8; // Jan-Aug actual, Sep-Dec forecast — drives the header subtitle/tag only.
var HEADER_SUBTITLE = 'Actuals through August, Forecast through December';
var HEADER_TAG = 'Actuals + Forecast'; // the resolved state for this fixed window (would be 'Actuals' before the switchover, 'Forecast' after FY close) // Risks & Opportunities — fixed list, no filtering.
var RISKS_OPPORTUNITIES = [ { id: 'r1', kind: 'risk', label: 'EMEA renewal delays', grossImpact: -3.6, probability: 0.85, weightedImpact: -3.06, metric: 'revenue', owner: 'M. Laurent · EMEA RVP', timing: 'Q4 FY26', entity: 'EMEA', includedInForecast: true }, { id: 'r2', kind: 'opportunity', label: 'Cloud infrastructure savings', grossImpact: 1.4, probability: 0.9, weightedImpact: 1.26, metric: 'ebitda', owner: 'T. Okafor · VP Engineering', timing: 'Q3–Q4 FY26', entity: 'group', includedInForecast: true }, { id: 'r3', kind: 'opportunity', label: 'APAC enterprise deal', grossImpact: 2.8, probability: 0.4, weightedImpact: 1.12, metric: 'revenue', owner: 'S. Tanaka · APAC RVP', timing: 'Q4 FY26', entity: 'APAC', includedInForecast: false }, { id: 'r4', kind: 'opportunity', label: 'Hiring delays / cost timing', grossImpact: 1.8, probability: 0.75, weightedImpact: 1.35, metric: 'ebitda', owner: 'R. Chen · CHRO', timing: 'Q3–Q4 FY26', entity: 'group', includedInForecast: true }, { id: 'r5', kind: 'risk', label: 'FX exposure', grossImpact: -2.2, probability: 0.5, weightedImpact: -1.1, metric: 'cash', owner: 'J. Meyer · Treasury', timing: 'Q4 FY26', entity: 'group', includedInForecast: false }
];
// weightedImpact = grossImpact * probability (already computed above — don't re-derive).
// Impact bar width: scale by |weightedImpact| relative to the max |weightedImpact| across all 5 rows.
// "region tag" = entity ('group' renders as "Group", not attributable to one region). // Performance heatmap — hardcoded to Region (no dimension toggle). Rows = KPI,
// columns = the 3 regions. Cells shaded by favorability of forecast vs budget.
var HEATMAP = { categories: ['North America', 'EMEA', 'APAC'], revenue: { budget: [87.975, 68.425, 39.1], forecast: [88.975, 62.925, 39.5] }, ebitda: { budget: [15.6, 9.8, 5.8], forecast: [16.3, 8.8, 6.7] }, grossMarginPct: { budget: [74.0, 72.5, 74.5], forecast: [75.0, 71.0, 76.0] }
};
// favorable if forecast >= budget for revenue/ebitda/grossMarginPct (none inverted here).
// Shade cells by direction (favorable/unfavorable), not by magnitude gradient — remember the
// "ambient glass" rule below: favorability is carried by glyph/hatch, never by hue. // P&L — flat static reference table, no hierarchy, no computed columns. Values
// are the real authored FY26 figures (EUR millions); render exactly as given.
var PNL_ROWS = [ { label: 'Subscription revenue', forecast: 162.0, budget: 165.0, priorYear: 148.5 }, { label: 'Services revenue', forecast: 29.4, budget: 30.5, priorYear: 29.7 }, { label: 'Hosting and infrastructure', forecast: 24.00, budget: 29.00, priorYear: 27.0 }, { label: 'Customer support', forecast: 13.80, budget: 14.00, priorYear: 13.5 }, { label: 'Professional services delivery', forecast: 11.58, budget: 9.58, priorYear: 9.0 }, { label: 'Gross profit', forecast: 142.02, budget: 142.92, priorYear: 128.70 }, { label: 'Sales & Marketing', forecast: 57.90, budget: 61.50, priorYear: 56.2 }, { label: 'Research & Development', forecast: 33.90, budget: 33.50, priorYear: 29.0 }, { label: 'General & Administrative', forecast: 18.42, budget: 16.72, priorYear: 16.0 }, { label: 'EBITDA', forecast: 31.80, budget: 31.20, priorYear: 27.50 }, { label: 'Depreciation & amortization', forecast: 8.70, budget: 8.50, priorYear: 7.90 }, { label: 'Operating income', forecast: 23.10, budget: 22.70, priorYear: 19.60 }, { label: 'Net financial result', forecast: 0.90, budget: 1.20, priorYear: 1.50 }, { label: 'Pre-tax income', forecast: 22.20, budget: 21.50, priorYear: 18.10 }
];
// These are literal hardcoded values per row (Gross profit / EBITDA / Operating income /
// Pre-tax income are shown as plain rows here too, NOT computed rollups — just display
// their literal numbers above like every other row). Trust every number here and above —
// don't re-derive or invent your own, and don't hand-check them against anything before
// moving on; that verification has already been done once and doesn't need repeating.
```
If instead Question 1 redirected this to a meaningfully different tool, or Question 2 pointed to real Pigment data, this dataset doesn't apply — build whatever the real answers call for. ## Visual style — "ambient glass" theme
Use these exact tokens and rules for the build, regardless of what the final data/use-case turns out to be. This visual language is unchanged by the scope cuts above. **Background scene**: a single full-bleed background painted once per viewport size as a canvas raster (not per-frame) — an "azure noon" composition: a bright saturated azure field, darkest in the top-right, one elongated tilted silver-white bloom low-left with a haze tail up the left edge, a coral-peach light leak braided into the bottom-left fog, and faint diagonal wave striations from seeded noise. **Glass panels**: every panel is a simple translucent dark glass slab over that scene — one flat `rgba(black, ~0.4)` fill, no borders, no per-panel gradients, no `backdrop-filter` (layered blur causes visible tile seams on some GPUs, which is why the source deliberately avoids it). **Text system**: all text and UI chrome is white at varying opacity only — no hue anywhere. Primary text ~95% white, secondary ~62%, tertiary ~40%, whisper/disabled ~28%, hairlines ~6–16% white. **Favorability rule — no color coding**: favorable/unfavorable states are carried entirely by ▲/▼ glyphs and +/− signs plus a diagonal white hatch pattern for "unfavorable" fills (e.g. `repeating-linear-gradient(135deg, rgba(255,255,255,0.92) 0px, rgba(255,255,255,0.92) 2px, rgba(255,255,255,0.16) 2px, rgba(255,255,255,0.16) 5px)`) — never a color. Apply this to the KPI variance lines, the risks impact bars, and the heatmap cell shading alike. **Fonts**: since this environment cannot embed or fetch custom web fonts, use system font stacks only — sans: `-apple-system, BlinkMacSystemFont, "Helvetica Neue", Arial, sans-serif` for all headings/body text; mono: `SFMono-Regular, Menlo, Consolas, monospace` for small metadata labels (section numbers, timestamps, tags). Do not attempt to load Instrument Sans/IBM Plex Mono or any other named font. **Design tokens — exact values, machine-readable**:
```js
var T = { ink: 'rgba(255,255,255,0.95)', // primary text ink2: 'rgba(255,255,255,0.62)', // secondary text ink3: 'rgba(255,255,255,0.40)', // tertiary / disabled text ink4: 'rgba(255,255,255,0.28)', // whisper text hairline: 'rgba(255,255,255,0.10)', hairlineSoft: 'rgba(255,255,255,0.06)', hairlineStrong: 'rgba(255,255,255,0.16)', fillFaint: 'rgba(255,255,255,0.04)', fillSoft: 'rgba(255,255,255,0.07)', veil: 'rgba(3,16,19,0.45)', // dark = scene shadow, not a color deep: '#0E3355', // darkest azure (text on white pills) sceneBase: '#2B6C9F', backdrop: 'rgba(8,30,52,0.30)', hatch: 'repeating-linear-gradient(135deg, rgba(255,255,255,0.92) 0px, rgba(255,255,255,0.92) 2px, rgba(255,255,255,0.16) 2px, rgba(255,255,255,0.16) 5px)'
};
var FONT_SANS = '-apple-system, BlinkMacSystemFont, "Helvetica Neue", Arial, sans-serif';
var FONT_MONO = 'SFMono-Regular, Menlo, Consolas, monospace';
``` **Icons**: the source's hand-drawn SVG markup is generic UI chrome (chevrons for expand/collapse, close, share, arrows, an inbox empty-state glyph, an alert triangle, a sparkle) — none of it is domain-specific to the panels kept in this scope, and the two icons tied to cut features (chevronDown/chevronRight, used only for P&L expand/collapse) don't apply anymore since the P&L is now a flat table. If you want a small glyph for the risk/opportunity kind tags or the region tag, a plain ▲/▼ or a one-character glyph is sufficient — no need to invent new SVG iconography for this build. **Layout — no leftover gap from the cut Forecast Landing panel:** header, then KPI strip (full-width), then **Performance Heatmap and Risks & Opportunities side by side in one row — Heatmap on the left at flex 7, Risks on the right at flex 5** (a ~58/42 split; this is the exact ratio the original design already used for Forecast Landing + Risks, just with the Heatmap dropped into Forecast Landing's old spot), then the P&L table full-width below. Do not stack Heatmap and Risks as two separate full-width rows — in the original 7-panel design Risks sat next to Forecast Landing, which is cut here, so putting Risks alone in a full-width row would leave a large empty gap next to it. Pairing it with the Heatmap instead fills that row properly, and reusing the original flex-7/flex-5 split (rather than inventing a new ratio) is what keeps both panels comfortably sized — the Heatmap needs the wider side since it has 4 data columns, Risks needs less since it's just a list. ## Quality bar
No console errors. Keep every panel — header status line, KPI strip, risks list, heatmap, and P&L table — deriving from the same underlying FY totals (e.g. the KPI card values and the P&L Revenue/EBITDA rows must agree) so nothing contradicts on screen. Clean up all listeners/timers/DOM the frame added when re-mounted.
Download this image. Attach it to the Modeler Agent chat to guide the Frame’s design.
Download this image. Attach it to the Modeler Agent chat to guide the Frame’s design.
Explore a marketing expense manager built in Pigment. Add, edit, and delete OPEX line items and watch monthly spend, category mix, and budget variance update live. See it in action.
.png?sv=2026-02-06&spr=https&st=2026-09-28T17%3A42%3A11Z&se=2026-09-28T19%3A31%3A11Z&sr=c&sp=r&sig=3bw3LlPjkB9Azn2gSCZQzNtOfO%2BMt%2FE7vxKlWHKfRlU%3D)
What to do:
Open and copy the prompt for this Frame. Paste it into the Modeler Agent chat.
Open and copy the prompt for this Frame. Paste it into the Modeler Agent chat.
Before building anything, ask me a few quick questions — one at a time, wait for my answer before asking the next one. Don't write any code or create anything until we're through all of them. Use the AskUser card to ask each question. **Question 1**: The attached screenshot is a marketing OPEX dashboard — a KPI row (budget/spend/forecast), a monthly spend chart, a category breakdown, a Committed-vs-Planned radar, and an editable expense table with an Add/Edit modal. Ask me simply: *"Does this use case match your intent, or were you picturing something a bit different?"* If I say something different, ask me to describe it in a sentence or two and go with that instead of the screenshot's version. **Question 2**: Ask me: *"Should I use made-up demo numbers for now, or hook this up to real data you already have in Pigment?"* **Question 3** (only if I said "real data" in Question 2): Ask me: *"Which List, Metric, or Table should it use?"* Wait for me to name it — don't guess or invent names. **Question 4** (only if I said "made-up demo numbers" in Question 2): Ask me: *"Want me to just fake it for now, or actually set up real Lists/Metrics for this later?"* If I want it set up for real, ask where (which Application/folder) before creating anything. **Then build it.** Tell me first that building the frame can take up to 10 minutes. Use my answers for what the tool actually does and where its data comes from. For the *look* — colors, card layout, fonts, spacing — match the attached screenshot's style exactly, regardless of what we land on for Questions 1–4. **If I said "made-up demo numbers" in Question 2 and the tool is still basically this OPEX-dashboard idea** (i.e. I didn't redirect it to something substantially different in Question 1), use this exact dataset verbatim instead of inventing your own — it's already internally consistent and screenshot-accurate, so there's no need to make up or tune numbers: ```js
var CATEGORIES = [ 'Campaigns & paid media', 'Events & sponsorships', 'Agencies & contractors', 'Software & tools', 'Content & creative production', 'Customer research', 'Travel & entertainment'
];
var CATEGORY_SHORT = ['Campaigns', 'Events', 'Agencies', 'Software', 'Content', 'Research', 'Travel'];
var ANNUAL_BUDGET = 4000; // thousands EUR var MOCK_EXPENSES = [ { name: 'Paid media program', category: 'Campaigns & paid media', annualForecast: 1050, allocation: 'even', startMonth: 1, endMonth: 12, status: 'committed' }, { name: 'Customer conference', category: 'Events & sponsorships', annualForecast: 480, allocation: 'onetime', startMonth: 10, endMonth: 10, status: 'committed' }, { name: 'Creative agency retainer', category: 'Agencies & contractors', annualForecast: 620, allocation: 'even', startMonth: 1, endMonth: 12, status: 'committed' }, { name: 'Marketing automation platform', category: 'Software & tools', annualForecast: 310, allocation: 'even', startMonth: 1, endMonth: 12, status: 'committed' }, { name: 'Analytics and attribution tools', category: 'Software & tools', annualForecast: 120, allocation: 'even', startMonth: 1, endMonth: 12, status: 'committed' }, { name: 'Content production program', category: 'Content & creative production', annualForecast: 410, allocation: 'even', startMonth: 3, endMonth: 12, status: 'planned' }, { name: 'Brand research program', category: 'Customer research', annualForecast: 220, allocation: 'onetime', startMonth: 6, endMonth: 6, status: 'committed' }, { name: 'Travel and team events', category: 'Travel & entertainment', annualForecast: 340, allocation: 'even', startMonth: 1, endMonth: 12, status: 'planned' }
]; var MOCK_MONTHLY = [ { month: 1, value: 230, scenario: 'actual', budget: 300 }, { month: 2, value: 240, scenario: 'actual', budget: 300 }, { month: 3, value: 270, scenario: 'actual', budget: 320 }, { month: 4, value: 280, scenario: 'actual', budget: 320 }, { month: 5, value: 300, scenario: 'actual', budget: 330 }, { month: 6, value: 310, scenario: 'actual', budget: 340 }, { month: 7, value: 330, scenario: 'actual', budget: 350 }, { month: 8, value: 340, scenario: 'actual', budget: 350 }, { month: 9, value: 330, scenario: 'forecast', budget: 350 }, { month: 10, value: 360, scenario: 'forecast', budget: 360 }, { month: 11, value: 300, scenario: 'forecast', budget: 340 }, { month: 12, value: 260, scenario: 'forecast', budget: 340 }
];
// Each expense's annual amount lands on months per its allocation rule (one-time → full amount on
// startMonth only; even → split equally across every month from startMonth to endMonth inclusive).
// Spent to Date sums actualized months; Full-Year Forecast sums every expense's annual amount;
// Remaining Budget = ANNUAL_BUDGET - Full-Year Forecast. The radar's two series are each expense's
// annual amount summed per category, split by status (committed vs planned).
// Trust these numbers and formulas as-is — don't re-derive or invent your own.
```
If instead Question 1 redirected this to a meaningfully different tool, or Question 2 pointed to real Pigment data, this dataset doesn't apply — build whatever the real answers call for. ## Visual style — light, clean SaaS theme
Use these exact tokens for the build, regardless of what the final data/use-case turns out to be. **Fonts**: system stacks only — `-apple-system, BlinkMacSystemFont, "Helvetica Neue", Arial, sans-serif`. Do not attempt to fetch or embed any custom web font (no network access in this environment). **Icons** — use this exact SVG markup verbatim, do not redraw (hand-tuned 16×16 outline icons, 12×12 for the chevron; `currentColor` inherits each usage's icon color):
```html
<!-- plus: "+ Add" button --><svg viewBox="0 0 16 16" fill="none"><path d="M8 3.5V12.5M3.5 8H12.5" stroke="currentColor" stroke-width="1.5" stroke-linecap="round"/></svg>
<!-- edit: table row edit icon-button --><svg viewBox="0 0 16 16" fill="none"><path d="M11.3 2.3a1.5 1.5 0 0 1 2.1 2.1L5.6 12.2l-2.9.7.7-2.9 7.9-7.7Z" stroke="currentColor" stroke-width="1.5" stroke-linejoin="round"/></svg>
<!-- close: modal × button --><svg viewBox="0 0 16 16" fill="none"><path d="M4 4L12 12M12 4L4 12" stroke="currentColor" stroke-width="1.5" stroke-linecap="round"/></svg>
<!-- check: available for a confirm state --><svg viewBox="0 0 16 16" fill="none"><path d="M3.5 8.5L6.5 11.5L12.5 4.5" stroke="currentColor" stroke-width="1.5" stroke-linecap="round" stroke-linejoin="round"/></svg>
<!-- chevron-down: custom select-dropdown arrow, replaces the native OS one --><svg viewBox="0 0 12 12" fill="none"><path d="M3 4.5L6 7.5L9 4.5" stroke="currentColor" stroke-width="1.5" stroke-linecap="round" stroke-linejoin="round"/></svg>
``` **Design tokens** — exact values, machine-readable:
```js
var TOKENS = { colors: { white: '#FFFFFF', grey10: '#F7F7F8', grey20: '#E8EAED', grey30: '#949FB2', grey50: '#5A657A', grey90: '#020D23', cardBorder: 'rgba(2,13,35,0.08)', hoverFill: 'rgba(2,13,35,0.04)', primary10: '#F0F5FF', primary20: '#95B9FF', primary30: '#2684FF', primary50: '#0355F3', primary90: '#0038A4', primaryLightTransparent: 'rgba(3,85,243,0.05)', negative50: '#D02B41', negative10: '#FFF0F2', negative90: '#740C19', category: ['hsl(219,98%,48%)', 'hsl(147,99%,33%)', 'hsl(259,100%,77%)', 'hsl(36,100%,55%)', 'hsl(185,100%,34%)', 'hsl(345,87%,63%)', 'hsl(43,100%,48%)'], // cycle in order, 1 per category focusRing: '0 0 0 3px rgba(149,185,255,1)' // primary20 }, // role: [size, weight, lineHeight, color] type: { pageTitle: ['24px', 500, '32px', 'grey90'], pageSubtitle: ['14px', 400, '20px', 'grey50'], sectionTitle: ['16px', 600, '24px', 'grey90'], kpiLabel: ['11px', 400, '16px', 'grey50'], // uppercase kpiValue: ['28px', 500, '36px', 'grey90-or-negative50'], tableColumnHeader: ['11px', 400, '16px', 'grey50'], // uppercase tableCellOrFieldLabel: ['14px', 500, '20px', 'grey90'], categoryRowFigures: ['12px', 400, '16px', 'grey50'] }, radius: { xs: '4px', sm: '6px' }, // xs = cards/buttons/inputs, sm = modal panel only (the one real drop shadow at rest) components: { button: '32px tall, 4px radius, no visible border — primary: solid primary50/white, hover primary90; secondary/ghost: primaryLightTransparent or transparent with primary50 text', input: '32px tall, 4px radius, white bg, grey20 inset border, focus -> primary30 border + focusRing', chip: 'fully rounded (9999px), 20px tall, 12px text, no border', card: 'flat, 1px cardBorder, no shadow at rest, soft shadow on hover' }
};
``` ## Quality bar
No console errors. Whatever data source we land on, keep every panel deriving from the same underlying values so nothing contradicts on screen. Clean up all listeners/timers/DOM the frame added when re-mounted.
Download this image. Attach it to the Modeler Agent chat to guide the Frame’s design.
Download this image. Attach it to the Modeler Agent chat to guide the Frame’s design.
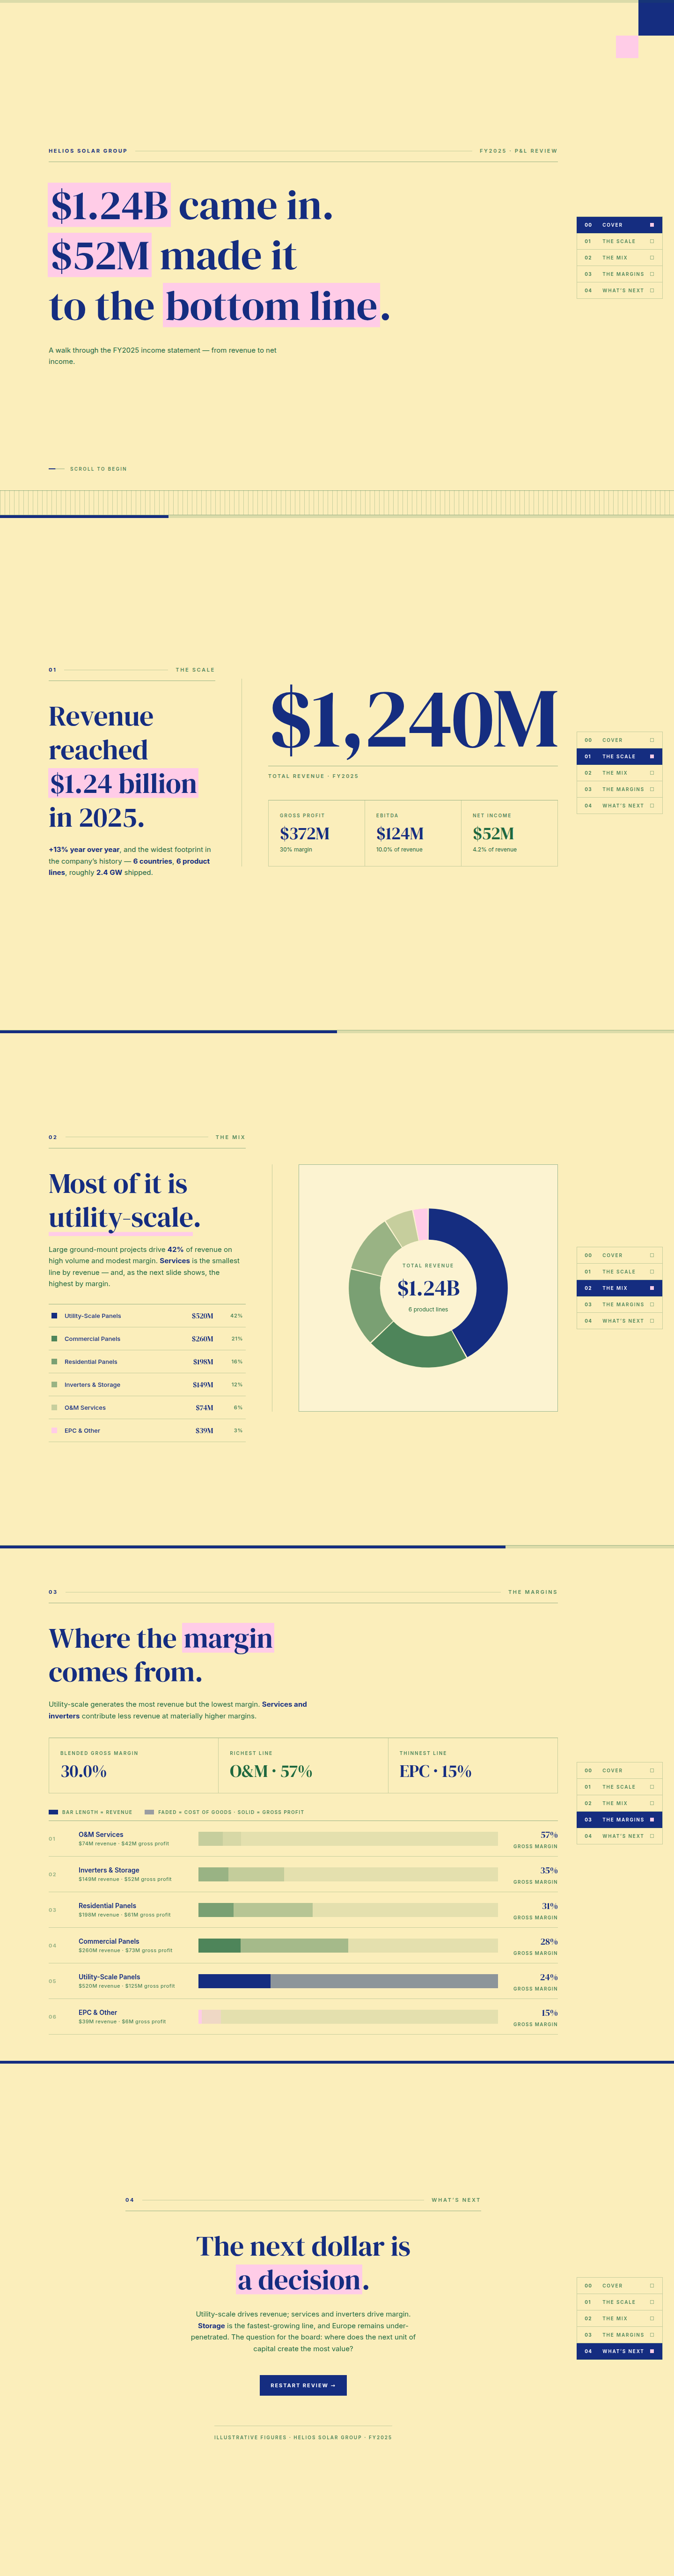
Explore a P&L story deck built in Pigment. Scroll through FY2025 revenue, margin, and geographic mix as a guided narrative, from the topline down to net income. See it in action.
What to do:
Open and copy the prompt for this Frame. Paste it into the Modeler Agent chat.
Open and copy the prompt for this Frame. Paste it into the Modeler Agent chat.
Before building anything, ask me a few quick questions — one at a time, wait for my answer before asking the next one. Don't write any code or create anything until we're through all of them. Use the AskUser card to ask each question. **Question 1**: The attached screenshot is a scroll-driven annual P&L review deck — a cover slide, then three story slides you scroll through in order: "The Scale" (headline revenue/gross-profit/EBITDA/net-income figures), "The Mix" (a donut of revenue by product line with a hover-linked legend), and "The Margins" (a ranked list of product lines by gross margin) — closing on a "What's Next" slide. A fixed side index and a top progress bar track scroll position throughout. Ask me simply: *"Does this use case match your intent, or were you picturing something a bit different?"* If I say something different, ask me to describe it in a sentence or two and go with that instead of the screenshot's version. **Question 2**: Ask me: *"Should I use made-up demo numbers for now, or hook this up to real data you already have in Pigment?"* **Question 3** (only if I said "real data" in Question 2): Ask me: *"Which List, Metric, or Table should it use?"* Wait for me to name it — don't guess or invent names. **Question 4** (only if I said "made-up demo numbers" in Question 2): Ask me: *"Want me to just fake it for now, or actually set up real Lists/Metrics for this later?"* If I want it set up for real, ask where (which Application/folder) before creating anything. **Then build it.** Tell me first that building the frame can take up to 10 minutes. Before writing any code, open and actually look at the attached screenshot — every slide, not just the cover. Skipping this step is the single biggest cause of a wrong build (and a wrong build is far slower to fix than reading the image once up front). Use my answers for what the tool actually does and where its data comes from. For the *look* — colors, panel layout, fonts, spacing — match the attached screenshot's style exactly, regardless of what we land on for Questions 1–4. **The screenshot may show a mid-edit or scrolled state, not necessarily every slide at once** — don't try to match any one frame of it pixel-for-pixel if a slide below is described differently; the slide descriptions and dataset here are the source of truth for scope, the screenshot is the source of truth for visual style only. **Deliberate scope cuts versus the original design** (this deck was originally a longer, more elaborate build; this version keeps the simplest, cheapest slides and drops the two most expensive charts entirely):
1. **"The Ledger" slide is gone entirely.** No revenue-to-net-income waterfall/bridge chart, no connector lines, nothing tied to the P&L walk. This was the single most expensive component in the original (custom bridge-chart math) — don't rebuild anything equivalent to it.
2. **"The Map" slide is gone entirely.** No treemap, no country/region breakdown, no click-to-drill interaction. This was the other most expensive component (a custom squarified-treemap layout algorithm) — don't rebuild anything equivalent to it.
3. **No scroll-triggered reveal animations, and no animated number count-ups.** Every slide's text, big numbers, and charts render fully in place as soon as you scroll to them — nothing fades/slides in, and headline figures (like "$1.24B") display their final value immediately rather than counting up.
4. **The fixed side index and top progress bar stay** — they're cheap (just scroll-position tracking + a jump-to-slide click handler) and they're what makes this read as a deck rather than a plain scrolling page. The side index lists exactly the 5 slides below, in order, and highlights whichever one is currently in view; clicking one jumps to it. The top progress bar fills left-to-right as you scroll through the whole deck.
5. **The Margins slide has no sort toggle.** Drop the Margin/Revenue/A→Z buttons entirely — always show the product lines sorted by gross margin descending (richest margin first), which is the order that best supports this slide's point.
6. **The donut (Mix slide) keeps its hover interaction** — hovering a segment or its matching legend row highlights that segment and swaps the center label to that product's figures. This is cheap (it's just an opacity toggle + text swap) and it's the deck's best interactive moment, so it stays.
7. **The restart button on the closing slide stays** — it's a one-line scroll-to-top action, effectively free. Net result: a 5-slide scrollable deck — Cover, The Scale, The Mix, The Margins, What's Next — with the fixed side nav and progress bar intact, a donut with a working hover, and a ranked bar-list. No waterfall, no treemap, no reveal choreography, no count-up animations, no sort toggle. **If I said "made-up demo numbers" in Question 2 and the tool is still basically this P&L review idea** (i.e. I didn't redirect it to something substantially different in Question 1), use this exact dataset verbatim instead of inventing your own — every figure below is extracted as-is from the original deck's authored FY2025 dataset, so it's already internally consistent and doesn't need tuning: ```js
// All monetary figures are in USD millions. // Headline totals for the Scale slide — must agree with the PRODUCTS sum below.
var TOTALS = { revenue: 1240, grossProfit: 372, grossMarginPct: 30, ebitda: 124, ebitdaPct: 10.0, netIncome: 52, netIncomePct: 4.2, yoyGrowthPct: 13, countries: 6, productLines: 6, gwShipped: 2.4
}; // Revenue by product line — drives both the Mix donut and the Margins list.
// margin is gross margin %; gross profit = rev * margin / 100 (don't re-derive, just display).
var PRODUCTS = [ { key: 'utility', name: 'Utility-Scale Panels', rev: 520, margin: 24 }, { key: 'commercial', name: 'Commercial Panels', rev: 260, margin: 28 }, { key: 'residential', name: 'Residential Panels', rev: 198, margin: 31 }, { key: 'inverter', name: 'Inverters & Storage', rev: 149, margin: 35 }, { key: 'om', name: 'O&M Services', rev: 74, margin: 57 }, { key: 'epc', name: 'EPC & Other', rev: 39, margin: 15 }
];
// TOTAL revenue = 1240 (sum of the above) — must equal TOTALS.revenue.
// Trust every number above — don't re-derive or invent your own, and don't
// hand-check them against anything before moving on; that verification has
// already been done once and doesn't need repeating.
```
If instead Question 1 redirected this to a meaningfully different tool, or Question 2 pointed to real Pigment data, this dataset doesn't apply — build whatever the real answers call for. ## Visual style — "editorial print" theme
Use these exact tokens and rules for the build, regardless of what the final data/use-case turns out to be. This visual language is unchanged by the scope cuts above. **Overall feel**: a large-format print/editorial layout — a flat pale field, oversized serif headlines, a strict grid, thin hairline rule dividers, and bordered panels that sit flush against each other with zero gaps and zero corner radius. Nothing floats on a shadow; everything is bordered, flat, and grid-aligned like a printed report. **Fonts**: since this environment cannot embed or fetch custom web fonts, use system stacks only — serif display: `Georgia, "Times New Roman", serif` for the large headline/big-number treatment (in place of the original's DM Serif Display); sans: `-apple-system, BlinkMacSystemFont, "Helvetica Neue", Arial, sans-serif` for everything else (body text, labels, buttons, nav). Do not attempt to load DM Serif Display, Inter, or any other named font. **Design tokens — exact values, machine-readable**:
```js
var C = { paper: '#FBEEBB', // page field panel: 'rgba(255,255,255,.32)', // translucent panel fill over the field ink: '#152D80', // primary navy ink (headlines, borders, buttons) ink70: '#1D683F', // secondary ink (body copy) — green, not navy ink50: 'rgba(29,104,63,.78)', // tertiary / eyebrow labels ink35: 'rgba(29,104,63,.44)', // faint labels line: 'rgba(29,104,63,.24)', // lightest hairline rule: 'rgba(29,104,63,.44)', // standard hairline / border accent: '#FFCCE7', // pink highlight (headline mark, EPC product color) // product-line ramp (also the donut/margins-bar colors) — flattened solid hexes, not raw opacity utility: '#152D80', commercial: '#4E855A', residential: '#7AA073', inverter: '#99B384', om: '#C6CE9D', epc: '#FFCCE7', pos: '#1D683F' // favorable figures
};
``` **Headline mark style**: key phrases in headlines (e.g. "$1.24B", "40%") get a `<span class="mark">` treatment — a solid pink (`accent`) highlight band behind the text only (not a full-width block), like a highlighter stroke: `background-image: linear-gradient(accent, accent); background-repeat: no-repeat; background-size: 100% 1.06em; background-position: 0 center;` with small horizontal padding so the highlight doesn't touch adjacent characters. **Panels & borders**: every panel (`.panel`) is `background: panel` (translucent white over the paper field) with a single `1px solid rule` border — no shadow, no radius. Where multiple cells sit in a grid (KPI cell row, margins list rows), borders are shared/collapsed between adjacent cells so dividers read as one continuous hairline grid, not doubled-up borders. **Cover slide decoration**: a solid navy (`ink`) square (76×76px) pinned to the top-right corner, with a smaller solid pink (`accent`) square (48×48px) offset just below-left of it; a repeating-hairline "stripe" band along the bottom edge (`repeating-linear-gradient(90deg, line 0 1px, transparent 1px 10px)`). **Chart colors**: the donut segments and the Margins bar fills use the same six product-line colors above — keep the mapping identical across both so a reader can carry color associations between slides (e.g. Utility-Scale is always navy `ink`, O&M Services is always `om`). **Layout**: one full-viewport-height slide (`<section>`) per story beat, scrolled through vertically — Cover, The Scale, The Mix, The Margins, What's Next, in that order. A fixed top progress bar reflects scroll position; a fixed right-side vertical index lists all 5 slides and jumps to one on click, highlighting whichever slide is currently in view. Two-column slides (Scale, Mix) use a text column plus a visual column, roughly 44/56 split. ## Quality bar
No console errors. Keep every slide deriving from the same underlying dataset (the Mix donut, the Margins list, and the Scale KPIs must all agree on the same product-line and total-revenue figures). Clean up all listeners/timers/observers/DOM the frame added when re-mounted.
Download this image. Attach it to the Modeler Agent chat to guide the Frame’s design.
Download this image. Attach it to the Modeler Agent chat to guide the Frame’s design.
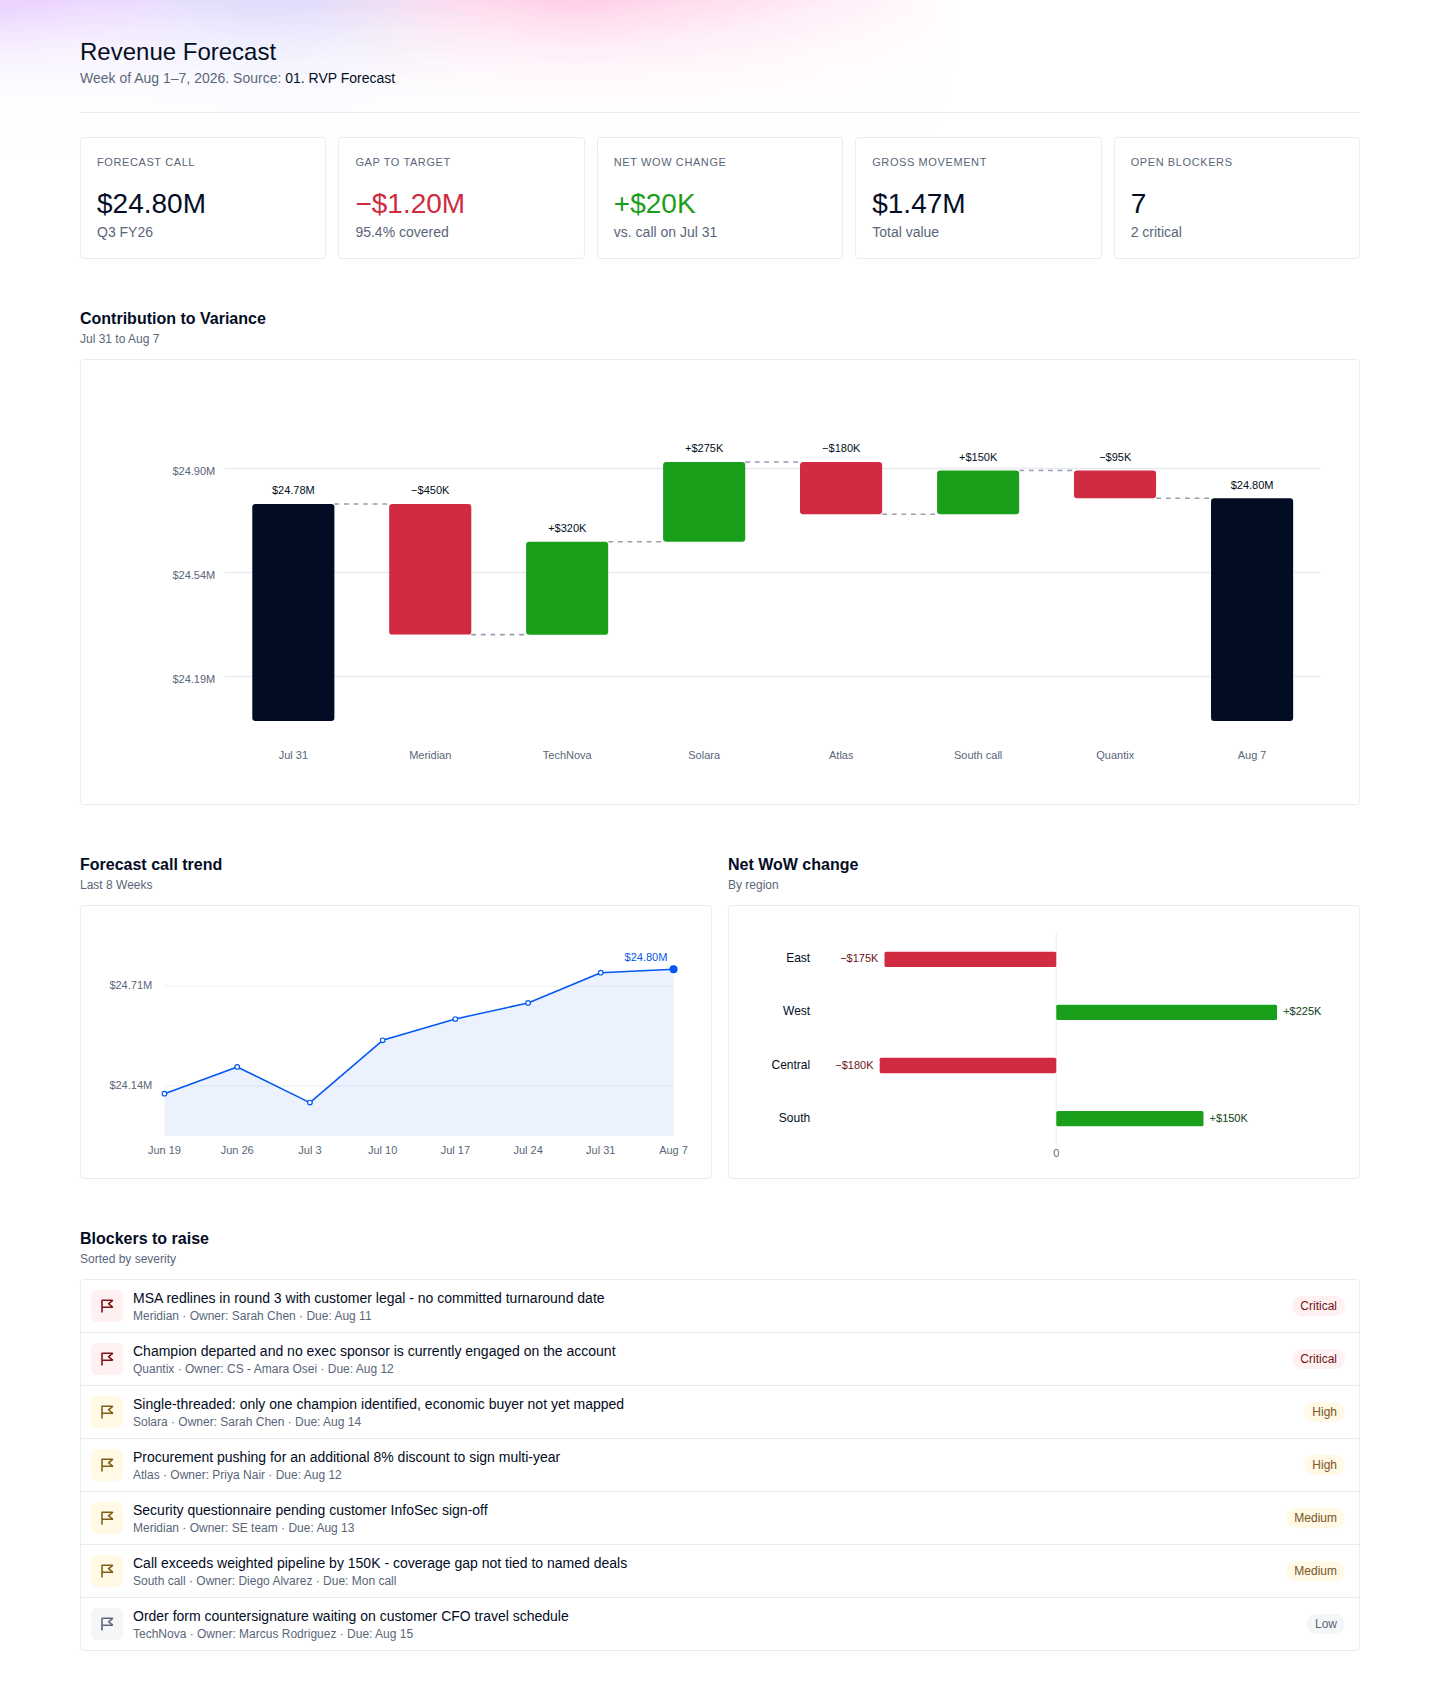
Explore a revenue forecast Frame built in Pigment. See exactly what moved the weekly call, the blockers behind it, and a scenario for closing the gap to target. See it in action.
What to do:
Open and copy the prompt for this Frame. Paste it into the Modeler Agent chat.
Open and copy the prompt for this Frame. Paste it into the Modeler Agent chat.
Before building anything, ask me a few quick questions — one at a time, wait for my answer before asking the next one. Don't write any code or create anything until we're through all of them. Use the AskUser card to ask each question. **Question 1**: The attached screenshot is a weekly sales forecast call review — a KPI row (forecast call, gap to target, net week-over-week change, gross movement, open blockers), a "Contribution to Variance" waterfall walking last week's call to this week's call through each named deal change, a forecast-call trend line (last 8 weeks) and a net-change-by-region bar chart side by side, and a "Blockers to raise" list sorted by severity. Clicking a blocker row opens a detail drawer for that deal — why it changed, before/after value, related blockers, suggested recovery levers, and its own highlighted spot on the waterfall. Ask me simply: *"Does this use case match your intent, or were you picturing something a bit different?"* If I say something different, ask me to describe it in a sentence or two and go with that instead of the screenshot's version. **Question 2**: Ask me: *"Should I use made-up demo numbers for now, or hook this up to real data you already have in Pigment?"* **Question 3** (only if I said "real data" in Question 2): Ask me: *"Which List, Metric, or Table should it use?"* Wait for me to name it — don't guess or invent names. **Question 4** (only if I said "made-up demo numbers" in Question 2): Ask me: *"Want me to just fake it for now, or actually set up real Lists/Metrics for this later?"* If I want it set up for real, ask where (which Application/folder) before creating anything. **Then build it.** Tell me first that building the frame can take up to 10 minutes. Before writing any code, open and actually look at the attached screenshot — every panel. Skipping this step is the single biggest cause of a wrong build (and a wrong build is far slower to fix than reading the image once up front). Use my answers for what the tool actually does and where its data comes from. For the *look*, this one is different from other frames: don't invent a custom visual style — copy the CSS given below verbatim into a single `<style>` tag in the Frame. It's Pigment's own real design-language stylesheet (the actual CSS this screenshot was rendered with), so every color, spacing, radius, and component class is already correct — don't rewrite, approximate, or "clean up" any of it. The two font-family variables (`--font-sans`, `--font-mono`) already carry a system-font fallback (`sans-serif` / `monospace`) for when the real Inter/Roboto Mono files aren't available, which is the case in this sandbox — don't try to load or embed those font files. **The screenshot may show a mid-edit or scrolled state, not necessarily every panel at once** — the panel descriptions and dataset here are the source of truth for scope, the screenshot is the source of truth for visual style only. **Deliberate scope cuts versus the original design** (this tool was originally a more elaborate build; this version keeps everything that carries the story and drops the parts that were pure interactive/engineering overhead):
1. **The "Closing the gap to target" section is gone entirely.** No lever toggles, no scenario simulator, no second waterfall recomputing live as levers are switched on/off, no "Reset scenario" button. This was the single most expensive part of the original build (a variable-length chart re-rendered on every toggle, with its own animation states) — don't rebuild anything equivalent to it. The suggested recovery levers still show up elsewhere (see below) — just never as a toggleable simulator.
2. **No auto-fit-to-card resize logic.** The original recalculated each chart's SVG `viewBox` from its container's live pixel size on every window resize. Give each chart (the waterfall, the trend line, the region bars) a fixed aspect ratio/height instead — simpler, and just as good-looking for a static build.
3. **No click-to-open-drawer from the chart bars.** Neither the waterfall bars nor any other chart element opens the detail drawer. The drawer is reachable exactly one way: clicking a row in the "Blockers to raise" list. That's still a real, working interaction — just one entry point instead of several.
4. **The trend chart has no hover tooltip.** Render the line/area chart exactly as shown — grid lines, the line, the point markers, the end-value label — but skip the per-point invisible hit-zones and the floating tooltip they used to drive. Net result: the same 5-panel page (KPIs, waterfall, trend + region charts, blockers list) plus a working detail drawer opened from the blockers list — just without the scenario simulator, without resize-responsive charts, and without extra hover/click affordances on the charts themselves. **If I said "made-up demo numbers" in Question 2 and the tool is still basically this forecast-review idea** (i.e. I didn't redirect it to something substantially different in Question 1), use this exact dataset verbatim instead of inventing your own — every figure below is extracted as-is from the original build's authored dataset, so it's already internally consistent and doesn't need tuning: ```js
// All monetary figures are in USD.
var LAST_WEEK = 24780000; // forecast call as of Jul 31
var TARGET = 26000000; // Q3 FY26 target // Named deal changes driving the waterfall, in the order they should appear
// (left to right, between the Jul 31 and Aug 7 total bars).
var CHANGES = [ { id: 'c1', kind: 'Slipped deal', short: 'Meridian', region: 'East', title: 'Meridian Health pushed to Q4', desc: 'Close date moved from Sep 28 to Oct 15. Deal removed from Q3 Commit after customer legal review extended.', delta: -450000, before: 450000, after: 0, owner: 'Sarah Chen', role: 'RVP East', when: 'Tue Aug 5, 2:14 PM', metric: 'Forecast Call - Commit', move: 'Commit → Pipeline (Q4)', note: 'Deal remains high-confidence for Q4. East Q3 commit now leans on the TechNova expansion and the Halcyon renewal.', blockers: [ { sev: 'Critical', text: 'MSA redlines in round 3 with customer legal - no committed turnaround date', owner: 'Sarah Chen', action: 'Escalate to Lumina legal counsel for a 48h redline turnaround', due: 'Aug 11' }, { sev: 'Medium', text: 'Security questionnaire pending customer InfoSec sign-off', owner: 'SE team', action: 'Chase InfoSec contact, offer a live review session', due: 'Aug 13' } ] }, { id: 'c2', kind: 'Upsell to Commit', short: 'TechNova', region: 'West', title: 'TechNova expansion moved to Commit', desc: 'Expansion module added after a successful pilot. RVP West pulled the deal from Best Case into Commit.', delta: 320000, before: 780000, after: 1100000, owner: 'Marcus Rodriguez', role: 'RVP West', when: 'Mon Aug 4, 10:02 AM', metric: 'Forecast Call - Commit', move: 'Best Case → Commit', note: 'Pilot success criteria were signed off Jul 31 and legal redlines are already cleared, so slip risk is low. Largest positive mover of the week.', blockers: [ { sev: 'Low', text: 'Order form countersignature waiting on customer CFO travel schedule', owner: 'Marcus Rodriguez', action: 'Confirm e-signature as fallback with procurement', due: 'Aug 15' } ] }, { id: 'c3', kind: 'New in Best Case', short: 'Solara', region: 'East', title: 'Solara Energy entered Best Case', desc: 'New enterprise opportunity created and immediately qualified into Best Case by the East team.', delta: 275000, before: 0, after: 275000, owner: 'Sarah Chen', role: 'RVP East', when: 'Sun Aug 3, 6:55 PM', metric: 'Forecast Call - Best Case', move: 'New → Best Case', note: 'Sourced from the partner channel. Entering Best Case in week 1 is unusual but materially improves East coverage.', blockers: [ { sev: 'High', text: 'Single-threaded: only one champion identified, economic buyer not yet mapped', owner: 'Sarah Chen', action: 'Multi-thread via partner intro to the VP Operations', due: 'Aug 14' } ] }, { id: 'c4', kind: 'Deal resized', short: 'Atlas', region: 'Central', title: 'Atlas Logistics deal size reduced', desc: 'Procurement negotiated scope down from 520K to 340K. Amount updated on the opportunity.', delta: -180000, before: 520000, after: 340000, owner: 'Priya Nair', role: 'RVP Central', when: 'Wed Aug 6, 9:41 AM', metric: 'Opportunity Amount', move: 'Amount change', note: 'Scope reduction removes the analytics add-on. The account team believes the add-on can return as a Q1 expansion.', blockers: [ { sev: 'High', text: 'Procurement pushing for an additional 8% discount to sign multi-year', owner: 'Priya Nair', action: 'Hold price, counter with extended payment terms instead', due: 'Aug 12' } ] }, { id: 'c5', kind: 'Judgment call', short: 'South call', region: 'South', title: 'RVP South raised call above pipeline', desc: 'Manual override of +150K on top of weighted pipeline based on late-stage momentum.', delta: 150000, before: 5100000, after: 5250000, owner: 'Diego Alvarez', role: 'RVP South', when: 'Wed Aug 6, 4:20 PM', metric: 'Forecast Call - Override', move: 'Override raised', note: 'Third consecutive week South has called above weighted pipeline. Historical accuracy for this RVP is strong (+/- 3%).', blockers: [ { sev: 'Medium', text: 'Call exceeds weighted pipeline by 150K - coverage gap not tied to named deals', owner: 'Diego Alvarez', action: 'Name the specific deals backing the override in the call', due: 'Mon call' } ] }, { id: 'c6', kind: 'Renewal at risk', short: 'Quantix', region: 'West', title: 'Quantix renewal flagged at risk', desc: 'Champion left the account. Renewal moved out of Commit pending an exec sponsor meeting.', delta: -95000, before: 95000, after: 0, owner: 'Marcus Rodriguez', role: 'RVP West', when: 'Thu Aug 7, 8:30 AM', metric: 'Forecast Call - Commit', move: 'Commit → At risk', note: 'CS has scheduled an exec sponsor meeting for Aug 12. Flagging early keeps the call honest rather than optimistic.', blockers: [ { sev: 'Critical', text: 'Champion departed and no exec sponsor is currently engaged on the account', owner: 'CS - Amara Osei', action: 'Exec sponsor meeting scheduled; prepare renewal value recap', due: 'Aug 12' } ] }
];
// NET = sum of all deltas above (+20,000). THIS_WEEK (the Aug 7 total bar) = LAST_WEEK + NET = 24,800,000.
// GROSS = sum of absolute deltas (1,470,000). GAP = TARGET - THIS_WEEK (-1,200,000).
// Blockers list = every change's blockers, flattened into one list, sorted Critical > High > Medium > Low.
// Region chart bars = each change's delta grouped and summed by its region field
// (East: -450,000+275,000=-175,000 · West: 320,000-95,000=225,000 · Central: -180,000 · South: 150,000). // Trend chart — forecast call over the last 8 weeks. Last point = THIS_WEEK.
var TREND = [24100000, 24250000, 24050000, 24400000, 24520000, 24610000, 24780000, 24800000];
var TREND_LBL = ['Jun 19', 'Jun 26', 'Jul 3', 'Jul 10', 'Jul 17', 'Jul 24', 'Jul 31', 'Aug 7']; // Recovery levers — shown per-change inside that change's detail drawer only
// (a "Recovery levers" list under the change, text + chips, no toggle/switch
// anywhere per scope cut #1). Only show a change's own lever(s), matched by changeId.
var LEVERS = [ { id: 'l1', label: 'Pull Meridian Health back into Q3', value: 450000, conf: 'Medium', weight: 0.5, changeId: 'c1', owner: 'Sarah Chen + Legal', action: '48h legal escalation on MSA redlines; offer signing incentive if countersigned by Sep 15' }, { id: 'l2', label: 'Convert Solara from Best Case to Commit', value: 275000, conf: 'Medium', weight: 0.6, changeId: 'c3', owner: 'Sarah Chen', action: 'Multi-thread to the economic buyer via partner intro; mutual close plan by Aug 14' }, { id: 'l4', label: 'Restore Atlas analytics add-on scope', value: 180000, conf: 'Low', weight: 0.3, changeId: 'c4', owner: 'Priya Nair', action: 'Re-bundle add-on with payment terms concession instead of the 8% discount' }, { id: 'l5', label: 'Save the Quantix renewal', value: 95000, conf: 'High', weight: 0.75, changeId: 'c6', owner: 'CS - Amara Osei', action: 'Exec sponsor meeting Aug 12; renewal value recap plus success roadmap' }
];
// Trust every number above — don't re-derive or invent your own, and don't
// hand-check them against anything before moving on; that verification has
// already been done once and doesn't need repeating.
```
If instead Question 1 redirected this to a meaningfully different tool, or Question 2 pointed to real Pigment data, this dataset doesn't apply — build whatever the real answers call for. ## Visual style — Pigment native design language
Copy the CSS below verbatim into a single `<style>` tag in the Frame — do not invent colors, spacing, radii, or component styles of your own. This is Pigment's own real design-language stylesheet (the actual CSS the attached screenshot was rendered with), so everything you need (KPI cards, section headers, the outlined/elevated card variants, list rows with dividers, severity/confidence chips, the floating side drawer) is already defined here as real CSS classes. Reference component classes by name (e.g. `card is-outlined`, `list-item`, `chip type-chip`, `drawer-panel`) rather than re-describing their styling in your own response — and don't re-paste this block back at me, just confirm you're using it. ```css
/* Pigment design-language stylesheet. Fonts are NOT bundled here: Inter and Roboto Mono have to be loaded before using this sheet, or the --font-sans / --font-mono fallbacks (sans-serif / monospace) will render instead.
*/ :root { /* Colors — neutral scale */ --color-white: #ffffff; --color-grey-10: #f7f7f8; --color-grey-20: #e8eaed; --color-grey-30: #949fb2; --color-grey-50: #5a657a; --color-grey-90: #020d23; --color-neutral-alpha: rgba(2, 13, 35, 0.08); --color-background-alpha: rgba(2, 13, 35, 0.04); --color-light-alpha: rgba(255, 255, 255, 0.64); /* Colors — brand */ --color-primary-10: #f0f5ff; --color-primary-20: #95b9ff; --color-primary-30: #2684ff; --color-primary-50: #0355f3; --color-primary-90: #0038a4; --color-primary-light-transparent: rgba(3, 85, 243, 0.05); /* Colors — semantic */ --color-positive-10: #eefdee; --color-positive-20: #d1fad1; --color-positive-50: #1a9f1a; --color-positive-90: #094f09; --color-cautious-10: #fff8e5; --color-cautious-20: #fff5cc; --color-cautious-50: #f3b921; --color-cautious-90: #7a5d11; --color-negative-10: #fff0f2; --color-negative-20: #ffd8dd; --color-negative-50: #d02b41; --color-negative-90: #740c19; --color-backdrop: rgba(2, 13, 35, 0.6); /* Colors — illustrative palette */ --color-cobalt-soft: hsl(212, 100%, 85%); --color-cobalt-vivid: hsl(219, 98%, 48%); --color-cobalt-bold: hsl(227, 72%, 29%); --color-emerald-soft: hsl(80, 66%, 88%); --color-emerald-vivid: hsl(147, 99%, 33%); --color-emerald-bold: hsl(147, 56%, 26%); --color-amethyst-soft: hsl(274, 100%, 90%); --color-amethyst-vivid: hsl(259, 100%, 77%); --color-amethyst-bold: hsl(270, 50%, 30%); --color-ochre-soft: hsl(47, 90%, 84%); --color-ochre-vivid: hsl(43, 100%, 70%); --color-ochre-bold: hsl(43, 100%, 16%); --color-sienna-soft: hsl(32, 90%, 84%); --color-sienna-vivid: hsl(36, 100%, 70%); --color-sienna-bold: hsl(19, 83%, 28%); --color-turquoise-soft: hsl(191, 100%, 85%); --color-turquoise-vivid: hsl(185, 100%, 40%); --color-turquoise-bold: hsl(190, 100%, 19%); --color-fuchsia-soft: hsl(328, 100%, 90%); --color-fuchsia-vivid: hsl(345, 87%, 63%); --color-fuchsia-bold: hsl(328, 89%, 24%); /* Colors — categorical / random-assignment palette (lists of entities: apps, boards, scenarios...) */ --color-categorical-1-fg: #013496; --color-categorical-1-bg: rgba(3, 85, 243, 0.24); --color-categorical-2-fg: #0a5442; --color-categorical-2-bg: rgba(20, 184, 146, 0.24); --color-categorical-3-fg: #32562f; --color-categorical-3-bg: rgba(116, 199, 109, 0.24); --color-categorical-4-fg: #414a75; --color-categorical-4-bg: rgba(143, 161, 255, 0.24); --color-categorical-5-fg: #4a00a2; --color-categorical-5-bg: rgba(87, 0, 191, 0.24); --color-categorical-6-fg: #134289; --color-categorical-6-bg: rgba(33, 115, 239, 0.24); --color-categorical-7-fg: #001eb9; --color-categorical-7-bg: rgba(0, 41, 255, 0.24); --color-categorical-8-fg: #354156; --color-categorical-8-bg: rgba(69, 84, 111, 0.24); --color-categorical-9-fg: #634f32; --color-categorical-9-bg: rgba(255, 204, 128, 0.24); --color-categorical-10-fg: #004871; --color-categorical-10-bg: rgba(0, 128, 200, 0.24); --color-categorical-11-fg: #2c5267; --color-categorical-11-bg: rgba(103, 191, 239, 0.24); --color-categorical-12-fg: #354d72; --color-categorical-12-bg: rgba(118, 173, 255, 0.24); --color-categorical-13-fg: #003293; --color-categorical-13-bg: rgba(0, 52, 154, 0.24); --color-categorical-14-fg: #0c5513; --color-categorical-14-bg: rgba(25, 183, 41, 0.24); --color-categorical-15-fg: #3a2e84; --color-categorical-15-bg: rgba(60, 48, 137, 0.24); --color-categorical-16-fg: #7b0344; --color-categorical-16-bg: rgba(215, 5, 118, 0.24); --color-categorical-17-fg: #772d48; --color-categorical-17-bg: rgba(240, 91, 145, 0.24); --color-categorical-18-fg: #761f54; --color-categorical-18-bg: rgba(206, 55, 146, 0.24); --color-categorical-19-fg: #6e4223; --color-categorical-19-bg: rgba(252, 151, 79, 0.24); --color-categorical-20-fg: #004631; --color-categorical-20-bg: rgba(0, 76, 53, 0.24); --color-categorical-21-fg: #0d4a34; --color-categorical-21-bg: rgba(18, 104, 73, 0.24); --color-categorical-22-fg: #615101; --color-categorical-22-bg: rgba(255, 215, 3, 0.24); --color-categorical-23-fg: #001391; --color-categorical-23-bg: rgba(0, 19, 145, 0.24); /* Colors — chart palette (ordered categorical series for data visualization) */ --color-chart-1: #0355f3; --color-chart-2: #4bc766; --color-chart-3: #ffbe5c; --color-chart-4: #f95a77; --color-chart-5: #6b1cb0; --color-chart-6: #1b2970; --color-chart-7: #c2dffa; --color-chart-8: #d0faca; --color-chart-9: #ffc8ac; --color-chart-10: #caeb9d; --color-chart-11: #c096e3; --color-chart-12: #fdaebc; /* Color aliases */ --text-primary: var(--color-grey-90); --text-secondary: var(--color-grey-50); --text-disabled: var(--color-grey-30); --text-highlight: var(--color-primary-50); --text-light-primary: var(--color-white); --text-light-secondary: var(--color-light-alpha); --text-positive: var(--color-positive-50); --text-negative: var(--color-negative-50); --border: var(--color-neutral-alpha); --bg-secondary-surface: var(--color-background-alpha); --bg-primary-surface: var(--color-white); /* Typography */ --font-sans: "Inter", sans-serif; --font-mono: "Roboto Mono", monospace; /* Radii */ --radius-min: 1px; --radius-xxs: 2px; --radius-xs: 4px; --radius-sm: 6px; --radius-md: 8px; --radius-lg: 12px; --radius-xl: 16px; --radius-circular: 5000px; /* Shadows */ --shadow-card: 0 1px 1px 0 rgba(2, 13, 35, 0.04), 0 0 0 1px rgba(2, 13, 35, 0.06), 0 2px 5px 0 rgba(2, 13, 35, 0.05); --shadow-card-hover: rgba(2, 13, 35, 0.08) 0px 2px 17px -1px, rgba(2, 13, 35, 0.06) 0px 0px 0px 1px, rgba(2, 13, 35, 0.04) 0px 1px 1px 0px; --shadow-floating-container: 0px 0px 0px 1px hsl(220deg 89.2% 7.25% / 5%), 0px 6px 10px -6px hsl(220deg 89.2% 7.25% / 12%), 0px 6px 20px 0px hsl(220deg 89.2% 7.25% / 16%); --shadow-floating-side-panel: 0px 0px 0px 1px hsl(220deg 89.2% 7.25% / 5%), 0px 4px 24px -4px hsl(220deg 89.2% 7.25% / 8%); --shadow-modal: hsl(226.7deg 73% 7.25% / 25%) 0px 2px 6px; --shadow-dragged-item: hsl(226.7deg 73% 7.25% / 20%) 0px 6px 20px -4px, hsl(226.7deg 73% 7.25% / 4%) 0px 0px 0px 1px; /* Motion */ --motion-snappy: 150ms ease-in; --motion-soft: 200ms ease-in-out; --focus-ring: 0 0 0 3px var(--color-primary-20); /* Spacing — 4px grid */ --space-0-5: 2px; --space-1: 4px; --space-1-5: 6px; --space-2: 8px; --space-2-5: 10px; --space-3: 12px; --space-4: 16px; --space-6: 24px; --space-7: 28px; --space-8: 32px; --space-12: 48px; --space-16: 64px; /* Breakpoints */ --breakpoint-xs: 0px; --breakpoint-sm: 600px; --breakpoint-md: 960px; --breakpoint-lg: 1280px; --breakpoint-xl: 1440px;
} /* Type Scale */
.type-marketing-title { font-family: var(--font-sans); font-size: 56px; font-weight: 500; line-height: 68px; letter-spacing: -1px; color: var(--text-primary); margin: 0;
}
.type-screen-title { font-family: var(--font-sans); font-size: 24px; font-weight: 500; line-height: 32px; color: var(--text-primary); margin: 0;
}
.type-content-title { font-family: var(--font-sans); font-size: 22px; font-weight: 500; line-height: 32px; color: var(--text-primary); margin: 0;
}
.type-section-title { font-family: var(--font-sans); font-size: 16px; font-weight: 600; line-height: 24px; color: var(--text-primary); margin: 0;
}
.type-kicker,
.type-column-title { font-family: var(--font-sans); font-size: 11px; font-weight: 400; line-height: 16px; letter-spacing: 0.6px; text-transform: uppercase; color: var(--text-secondary);
}
.type-highlight-figure { font-family: var(--font-sans); font-size: 28px; font-weight: 500; line-height: 36px; color: var(--text-primary); margin: 0;
}
.type-running-regular { font-family: var(--font-sans); font-size: 14px; font-weight: 400; line-height: 20px; color: var(--text-primary); margin: 0;
}
.type-running-heavy,
.text-input input,
.text-input select { font-family: var(--font-sans); font-size: 14px; font-weight: 500; line-height: 20px; color: var(--text-primary); margin: 0;
}
.type-running-small { font-family: var(--font-sans); font-size: 12px; font-weight: 400; line-height: 16px; color: var(--text-secondary); margin: 0;
}
.type-running-small-heavy { font-family: var(--font-sans); font-size: 12px; font-weight: 500; line-height: 16px; color: var(--text-secondary); margin: 0;
}
.type-fieldset-regular,
.field-label { font-family: var(--font-sans); font-size: 14px; font-weight: 500; line-height: 20px; color: var(--text-secondary);
}
.type-fieldset-small { font-family: var(--font-sans); font-size: 12px; font-weight: 500; line-height: 16px; color: var(--text-secondary);
}
.type-button-label,
.button,
.button-medium,
.button-small { font-family: var(--font-sans); font-size: 14px; font-weight: 500; line-height: 20px; white-space: nowrap; color: inherit;
}
.type-legal-notice { font-family: var(--font-sans); font-size: 10px; font-weight: 400; line-height: 12px; color: var(--text-secondary); margin: 0;
}
.type-code-running-regular { font-family: var(--font-mono); font-size: 14px; font-weight: 400; line-height: 20px; color: var(--text-primary);
}
.type-code-running-small { font-family: var(--font-mono); font-size: 12px; font-weight: 400; line-height: 16px; color: var(--text-primary);
}
.type-chip { font-family: var(--font-sans); font-size: 12px; font-weight: 400; line-height: 12px; color: var(--text-secondary); margin: 0;
}
.type-chart-label { font-family: var(--font-sans); font-size: 11px; font-weight: 400; line-height: 16px; color: var(--text-secondary); margin: 0;
} /* Font helpers */
.anchor-link { font-family: var(--font-sans); font-weight: 400; color: var(--text-highlight); text-decoration: underline; text-underline-offset: var(--space-0-5); text-decoration-thickness: 1px; width: fit-content;
} /* Buttons */
.button,
.icon-button,
.toggle-button,
.chip.is-clickable { display: inline-flex; align-items: center; justify-content: center; gap: var(--space-1); border: none; border-radius: var(--radius-xs); box-shadow: inset 0 0 0 2px var(--button-border-color, transparent); cursor: pointer; transition: background-color var(--motion-snappy), box-shadow var(--motion-snappy), color var(--motion-snappy);
}
.button svg { width: 16px; height: 16px;
}
.button:focus-visible { outline: none; box-shadow: inset 0 0 0 2px var(--button-border-color, transparent), var(--focus-ring);
}
.button-medium { padding: var(--space-1-5) var(--space-3);
}
.button-small { padding: var(--space-1) var(--space-2-5);
}
.button-primary { background: var(--color-primary-50); --button-border-color: var(--color-primary-50); color: var(--text-light-primary);
}
.button-primary:hover { background: var(--color-primary-90); --button-border-color: var(--color-primary-90);
}
.button-secondary { background: var(--color-primary-light-transparent); --button-border-color: transparent; color: var(--color-primary-50);
}
.button-secondary:hover { --button-border-color: var(--color-primary-light-transparent);
}
.button-ghost { background: transparent; --button-border-color: transparent; color: var(--color-primary-50);
}
.button-ghost:hover { background: var(--color-primary-light-transparent);
}
.button-ghost-grey { background: transparent; --button-border-color: transparent; color: var(--text-secondary);
}
.button-ghost-grey:hover { background: var(--color-background-alpha); color: var(--text-primary);
}
.button-danger-primary { background: var(--color-negative-50); --button-border-color: var(--color-negative-50); color: var(--text-light-primary);
}
.button-danger-primary:hover { background: var(--color-negative-90); --button-border-color: var(--color-negative-90);
}
.button-danger-secondary { background: var(--color-white); --button-border-color: var(--color-white); color: var(--color-negative-50);
}
.button-danger-secondary:hover { background: var(--color-negative-10); --button-border-color: var(--color-negative-10);
}
.button-transparent { background: rgba(255, 255, 255, 0.16); --button-border-color: transparent; color: var(--color-white);
}
.button-transparent:hover { background: rgba(255, 255, 255, 0.24);
}
.button[disabled],
.icon-button[disabled] { color: var(--text-disabled); cursor: not-allowed; pointer-events: none;
}
.button-primary[disabled],
.button-secondary[disabled],
.button-transparent[disabled] { background: var(--color-grey-10); --button-border-color: var(--color-grey-10);
}
.button-ghost[disabled],
.button-ghost-grey[disabled],
.button-danger-primary[disabled],
.button-danger-secondary[disabled] { background: transparent; --button-border-color: transparent;
} /* Icon Button */
.icon-button { display: inline-flex; align-items: center; justify-content: center; flex-shrink: 0; border: none; border-radius: var(--radius-xs); box-shadow: inset 0 0 0 2px var(--button-border-color, transparent); cursor: pointer; transition: background-color var(--motion-snappy), box-shadow var(--motion-snappy), color var(--motion-snappy);
}
.icon-button:focus-visible { outline: none; box-shadow: inset 0 0 0 2px var(--button-border-color, transparent), var(--focus-ring);
}
.icon-button svg,
.toggle-button svg { width: 16px; height: 16px;
}
.icon-button-medium { padding: var(--space-2);
}
.icon-button-small { padding: var(--space-1-5);
} /* Button Groups */
.button-group { display: flex; flex-direction: row; gap: var(--space-1); margin: 0; border: none; padding-inline: 0; padding-block: 0; padding: 0;
}
.toggle-button input { position: absolute; left: -100px; opacity: 0;
}
.toggle-button { color: var(--text-secondary); background: transparent; box-shadow: inset 0 0 0 1px var(--color-neutral-alpha, grey); border-radius: var(--radius-circular); padding-inline: var(--space-4);
}
.toggle-button:hover { color: var(--text-primary); background: var(--color-background-alpha); box-shadow: none;
}
.toggle-button:has(input:checked) { background: var(--color-primary-light-transparent); color: var(--text-highlight); box-shadow: none;
}
.toggle-button:has(input:checked):hover { box-shadow: inset 0 0 0 2px var(--color-primary-light-transparent, blue);
}
.toggle-button:has(input:focus-visible) { outline: none; box-shadow: var(--focus-ring);
} /* Headers */
.page-header,
.section-header,
.table-header,
.filter-header { width: 100%; display: flex; align-items: flex-start; justify-content: space-between; gap: var(--space-8);
}
.page-header-text,
.section-header-text,
.table-header-text,
.filter-header-primary-actions { display: flex; flex-direction: column; gap: 0;
}
.page-header-actions,
.section-header-actions,
.table-header-actions,
.filter-header-secondary-actions { display: flex; align-items: center; gap: var(--space-2); flex-shrink: 0;
}
.divider { width: 100%; height: 1px; border: none; margin: var(--space-6) 0 0; background: var(--border);
} /* Fieldset / Text Input */
.field { display: flex; flex-direction: column; gap: var(--space-1);
}
.text-input { display: flex; align-items: center; gap: var(--space-1); padding: var(--space-1-5) var(--space-2); border-radius: var(--radius-xs); background: var(--color-white); box-shadow: inset 0 0 0 1px var(--input-border-color, var(--color-grey-20)); transition: box-shadow var(--motion-snappy); position: relative;
}
.text-input:hover { --input-border-color: var(--color-primary-50);
}
.text-input:focus-within { box-shadow: inset 0 0 0 1px var(--color-primary-30), var(--focus-ring);
}
.text-input.is-error { --input-border-color: var(--color-negative-50);
}
.text-input.is-error:hover { --input-border-color: var(--color-negative-90);
}
.text-input.is-disabled { background: var(--color-grey-10); --input-border-color: var(--color-grey-20);
}
.text-input input,
.text-input select { flex: 1; min-width: 0; border: none; outline: none; background: transparent; appearance: none; -webkit-appearance: none; padding: 0;
}
.text-input select { width: 100%; padding-right: calc(var(--space-2) + 16px); cursor: pointer;
}
.text-input input::placeholder { color: var(--text-secondary); font-weight: 500;
}
.text-input input:disabled,
.text-input select:disabled { color: var(--text-disabled); cursor: not-allowed;
}
.text-input svg { width: 16px; height: 16px; flex-shrink: 0; color: var(--text-secondary);
}
.text-input select ~ svg { position: absolute; right: var(--space-2); top: 50%; transform: translateY(-50%); pointer-events: none;
}
.text-input.is-disabled svg { color: var(--text-disabled);
} /* Cards */
.card-grid { width: 100%; display: grid; grid-template-columns: repeat(3, 1fr); gap: var(--space-4);
}
.card { display: flex; flex-direction: column; gap: var(--space-4); box-sizing: border-box; padding: var(--space-4); background: var(--color-white); border-radius: var(--radius-xs);
}
.card-icon { display: flex; align-items: center; justify-content: center; flex-shrink: 0; width: var(--space-12); height: var(--space-12); background: var(--color-primary-light-transparent); color: var(--text-highlight); border-radius: var(--radius-xs);
}
.card-icon svg { width: var(--space-4); height: var(--space-4);
}
.card-header-row { display: flex; align-items: center; justify-content: space-between; gap: var(--space-2);
}
.card-grouped-text { display: flex; flex-direction: column; gap: var(--space-1);
}
.card-grouped-figure-text { display: flex; flex-direction: column; gap: 0;
}
.card-footer { margin-top: auto; padding-top: var(--space-3); display: flex; align-items: center; gap: var(--space-2);
} .card.is-outlined { border: 1px solid var(--border);
}
.card.is-elevated { box-shadow: var(--shadow-card);
}
.card [TRUNCATED — this prompt exceeds Excel's cell character limit. The full text is included as a .md file in the accompanying zip export.]
Download this image. Attach it to the Modeler Agent chat to guide the Frame’s design.
Download this image. Attach it to the Modeler Agent chat to guide the Frame’s design.
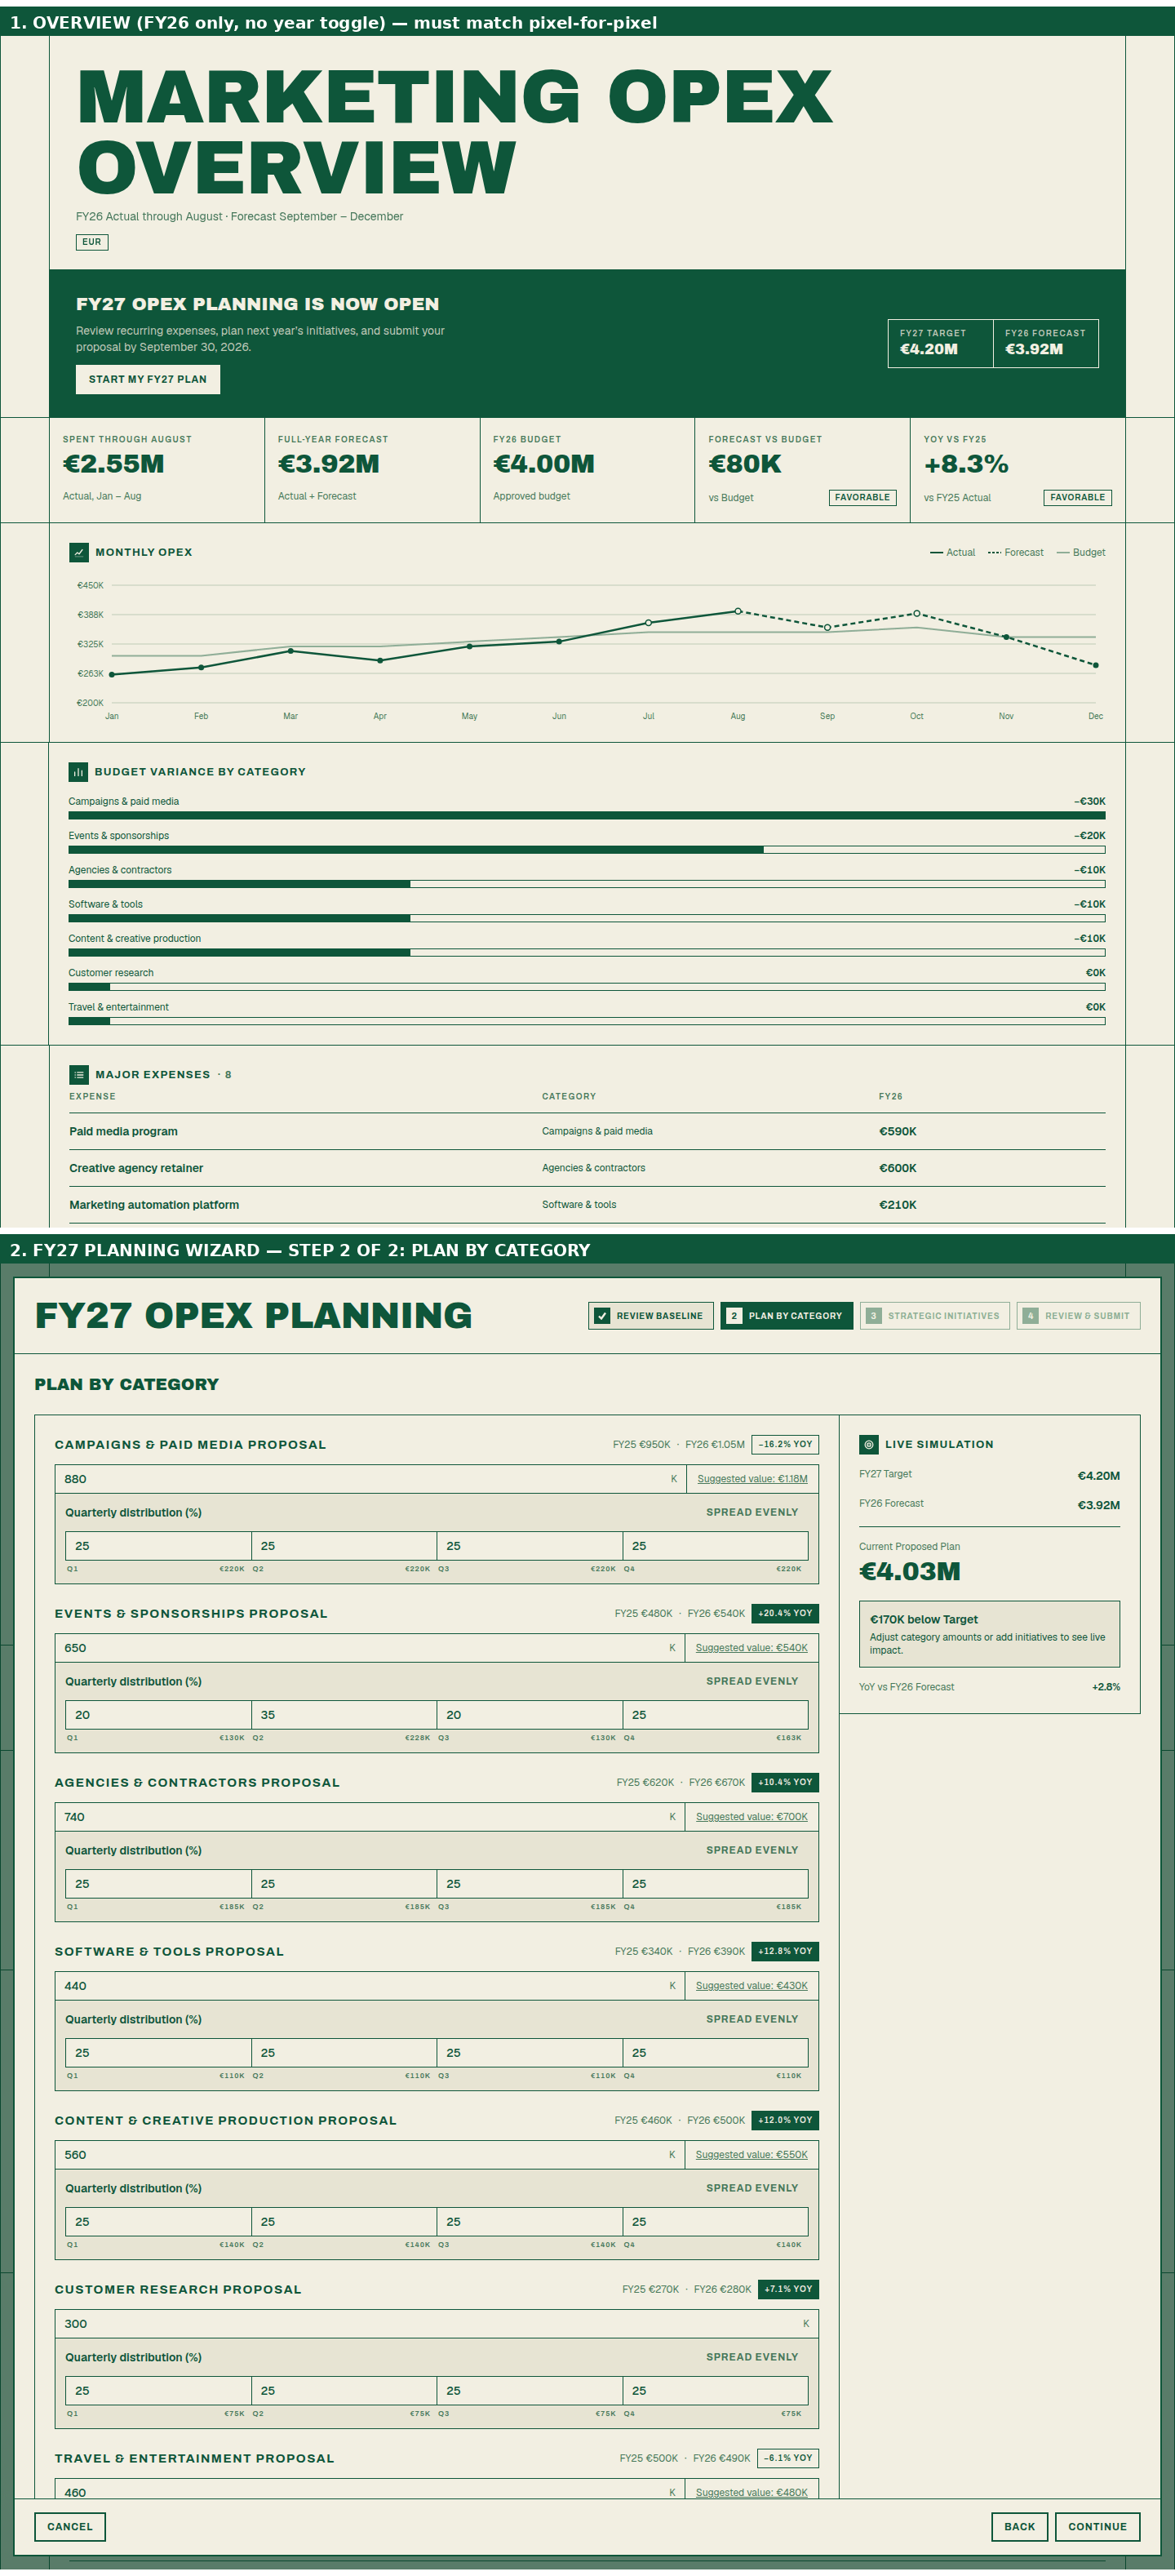
Explore a marketing OPEX planning Frame built in Pigment. Build an FY27 budget from carried-forward baselines and new initiatives, then submit it against target for Finance review. See it in action,
What to do:
Open and copy the prompt for this Frame. Paste it into the Modeler Agent chat.
Open and copy the prompt for this Frame. Paste it into the Modeler Agent chat.
Before building anything, ask me a few quick questions — one at a time, wait for my answer before asking the next one. Don't write any code or create anything until we're through all of them. Use the AskUser card to ask each question. **Question 1**: The attached screenshot is a marketing OPEX planning tool — an overview with a KPI band, a monthly actual-vs-budget line chart, a category-by-category variance breakdown (as a list, not a donut), and a read-only major-expenses list, plus a "start FY27 planning" flow that opens a 2-step wizard (review baseline recurring expenses and keep/remove/edit them, then plan next year's budget by category with a quarterly split and submit directly from that step). Ask me simply: *"Does this use case match your intent, or were you picturing something a bit different?"* If I say something different, ask me to describe it in a sentence or two and go with that instead of the screenshot's version. **Question 2**: Ask me: *"Should I use made-up demo numbers for now, or hook this up to real data you already have in Pigment?"* **Question 3** (only if I said "real data" in Question 2): Ask me: *"Which List, Metric, or Table should it use?"* Wait for me to name it — don't guess or invent names. **Question 4** (only if I said "made-up demo numbers" in Question 2): Ask me: *"Want me to just fake it for now, or actually set up real Lists/Metrics for this later?"* If I want it set up for real, ask where (which Application/folder) before creating anything. **Then build it.** Tell me first that building the frame can take up to 10 minutes. Before writing any code, open and actually look at the attached screenshot — every panel, including both the overview and the planning wizard steps. Skipping this step is the single biggest cause of a wrong build (and a wrong build is far slower to fix than reading the image once up front). Use my answers for what the tool actually does and where its data comes from. For the *look* — colors, card layout, fonts, spacing — match the attached screenshot's style exactly, regardless of what we land on for Questions 1–4. Write the Frame in one file pass — assemble the full body and write it once (or in 2–3 large passes at most), not as many small incremental edits. The dataset and design tokens below are for you to wire directly into the code; reference them by name in your own response rather than re-pasting the full arrays/objects back — restating them adds length without adding anything I need to review. **Deliberate scope cuts versus the original design** (these keep the build fast without losing anything actually load-bearing):
1. The overview's category breakdown is a **plain list of rows** (name, amount, % of total, variance) — do **not** build a donut/pie chart for it, that visual is dropped entirely.
2. **There is no year toggle.** The FY25/FY26/FY27 year pills from the original design are gone entirely — there is exactly one live data state (FY26), and the KPI band, chart, and variance rows are defined for that one state only. Don't build per-year branching for a control that doesn't exist.
3. **The major-expenses table keeps only 3 columns: Expense, Category, Value.** Drop Timing, the year-over-year Comparison column, and the Variance column entirely — no per-row budget/variance math on this table, it's a plain reference list now.
4. The planning wizard is **2 steps** — step 1 is baseline review, step 2 is plan-by-category and ends with the submit action directly. There is no "Strategic initiatives" step, no separate review step, and no waterfall chart anywhere in this build.
5. The planning screen's "live simulation" panel keeps the big current-plan total and the under/over-target status line, but **drops the small per-quarter mini-bar row** underneath — that row added a second live-updating visualization for the same information the total and status line already carry.
6. Within step 2, **recompute the proposed total and every derived figure (KPI band, quarterly amounts, overage-vs-target) only when the user clicks Continue/Submit or moves focus out of a field (`blur`) — never on every keystroke.** Do not build a live-typing in-place DOM-patching layer to keep inputs focused while values update underneath them; a normal re-render triggered by blur/Continue is fine and is what most of the build-time cost was going toward. Only the monthly line chart remains as a real chart — everything else on both the overview and the wizard is rows, cards, and simple bars (flat divs, not canvas/SVG chart geometry). **The step-2 screenshot is a mid-edit snapshot, not the default state — don't try to match its specific input numbers.** The screenshot shows Campaigns & paid media's amount as 880 with a €4.03M proposed total; the dataset below defaults that same field to `CATEGORY_ANNUAL['Campaigns & paid media'].fy27plan` = 1180 (total €4.18M). That's expected: someone had already typed a different number into that field before the screenshot was taken. Seed every category input from its `fy27plan` value and let the totals land wherever that puts them — only the layout, styling, and interaction pattern of step 2 are the visual reference, not that one field's specific value. **The exact interaction scheme for step 2 — use this scheme as given, don't design your own from scratch:**
- The "Suggested value" link and the "Spread evenly" button each use a `mousedown` listener with `event.preventDefault()`, not `click` — this sidesteps the blur-before-click race entirely for these two controls, since `preventDefault()` on `mousedown` stops the field from ever losing focus in the first place.
- Every amount/quarterly input's `blur` handler defers its re-render one tick via `setTimeout(fn, 0)` rather than re-rendering synchronously. Do this even though it looks unnecessary: a synchronous re-render inside `blur` can tear down the DOM before the browser finishes processing whatever caused the blur (e.g. a Tab keypress moving focus to the next field), which is a real, hard-to-reproduce focus bug — the one-tick defer sidesteps it for free.
- Don't build any additional focus-tracking logic beyond these two rules (no "skip render if focus is mid-transit" checks) — the `mousedown`/`preventDefault` rule above already covers the one case that would otherwise need it. **One more small lever for build speed**: extend the shared render-helper pattern (e.g. one generic `card(title, bodyHtml)`, one `kpiCard(...)`, one `row(...)`) to the KPI cards, variance rows, and category-plan cards too, not just the page-level wrapper/section-header helpers — these are the most repetitive, most bespoke-feeling blocks in the build, and routing them through a shared helper cuts the most redundant string-concatenation. **If I said "made-up demo numbers" in Question 2 and the tool is still basically this marketing-OPEX-planning idea** (i.e. I didn't redirect it to something substantially different in Question 1), use this exact dataset verbatim instead of inventing your own — it's already internally consistent and screenshot-accurate, so there's no need to make up or tune numbers: ```js
// All monetary figures are in thousands of EUR (€K) unless noted.
var CATEGORIES = [ 'Campaigns & paid media', 'Events & sponsorships', 'Agencies & contractors', 'Software & tools', 'Content & creative production', 'Customer research', 'Travel & entertainment'
];
var CATEGORY_COLORS = ['#09402B', '#0E563A', '#2F6F51', '#538868', '#79A283', '#A1C0A6', '#C8DCC8']; // fy25a=FY25 Actual (needed only as FY26's prior-year YoY comparator),
// fy26f=FY26 Forecast, fy26b=FY26 Budget, fy27plan=FY27 Proposed default
// (the value each category's Step-2 amount input starts at).
var CATEGORY_ANNUAL = { 'Campaigns & paid media': { fy25a: 950, fy26f: 1050, fy26b: 1080, fy27plan: 1180 }, 'Events & sponsorships': { fy25a: 480, fy26f: 540, fy26b: 560, fy27plan: 540 }, 'Agencies & contractors': { fy25a: 620, fy26f: 670, fy26b: 680, fy27plan: 700 }, 'Software & tools': { fy25a: 340, fy26f: 390, fy26b: 400, fy27plan: 430 }, 'Content & creative production': { fy25a: 460, fy26f: 500, fy26b: 510, fy27plan: 550 }, 'Customer research': { fy25a: 270, fy26f: 280, fy26b: 280, fy27plan: 300 }, 'Travel & entertainment': { fy25a: 500, fy26f: 490, fy26b: 490, fy27plan: 480 }
}; var MONTHS = ['Jan','Feb','Mar','Apr','May','Jun','Jul','Aug','Sep','Oct','Nov','Dec'];
// scenario is 'A' (Actual) for Jan-Aug and 'F' (Forecast) for Sep-Dec.
var MONTHLY = [ { value: 260, scenario: 'A', budget: 300 }, { value: 275, scenario: 'A', budget: 300 }, { value: 310, scenario: 'A', budget: 320 }, { value: 290, scenario: 'A', budget: 320 }, { value: 320, scenario: 'A', budget: 330 }, { value: 330, scenario: 'A', budget: 340 }, { value: 370, scenario: 'A', budget: 350 }, { value: 395, scenario: 'A', budget: 350 }, { value: 360, scenario: 'F', budget: 350 }, { value: 390, scenario: 'F', budget: 360 }, { value: 340, scenario: 'F', budget: 340 }, { value: 280, scenario: 'F', budget: 340 }
]; var FY27_TARGET = 4200;
var PLANNING_DEADLINE = 'September 30, 2026'; // Step 1 baseline recurring expenses (illustrative subsets of each category's
// total, not a full breakdown of it).
var BASELINE_ITEMS_SOURCE = [ { id: 'b1', name: 'Creative agency retainer', category: 'Agencies & contractors', fy26: 600, fy27: 600 }, { id: 'b2', name: 'Marketing automation platform', category: 'Software & tools', fy26: 210, fy27: 215 }, { id: 'b3', name: 'Analytics and attribution tools', category: 'Software & tools', fy26: 140, fy27: 145 }, { id: 'b4', name: 'Customer research subscription', category: 'Customer research', fy26: 260, fy27: 260 }, { id: 'b5', name: 'Recurring industry sponsorship', category: 'Events & sponsorships', fy26: 380, fy27: 390 }, { id: 'b6', name: 'Baseline travel program', category: 'Travel & entertainment', fy26: 480, fy27: 480 }
];
// Each item also carries a `kept` boolean (default true, toggled in the
// wizard's Keep/Remove control) and an editable `amount` seeded from fy27. // Overview's read-only major-expenses list — 3 columns only: Expense, Category,
// Value (Value is the FY26 figure; there is no per-row Timing, Comparison, or
// Variance column in this build).
var EXPENSE_LIST = [ { id: 'e1', name: 'Paid media program', category: 'Campaigns & paid media', value: 590 }, { id: 'e2', name: 'Creative agency retainer', category: 'Agencies & contractors', value: 600 }, { id: 'e3', name: 'Marketing automation platform', category: 'Software & tools', value: 210 }, { id: 'e4', name: 'Analytics and attribution tools', category: 'Software & tools', value: 140 }, { id: 'e5', name: 'Annual customer conference', category: 'Events & sponsorships', value: 230 }, { id: 'e6', name: 'Industry sponsorships', category: 'Events & sponsorships', value: 200 }, { id: 'e7', name: 'Brand research program', category: 'Customer research', value: 160 }, { id: 'e8', name: 'Team travel and events', category: 'Travel & entertainment', value: 245 }
]; // Default wizard state before the user edits anything:
// - categoryPlans[cat] = CATEGORY_ANNUAL[cat].fy27plan for every category.
// - quarterly[cat] = [25,25,25,25] for every category except Events &
// sponsorships, which is [20,35,20,25]. // Calculation model:
// sumCategories(field) = sum of CATEGORY_ANNUAL[cat][field] over all cats
// sumMonthly(field,from,to) = sum of MONTHLY[i][field] for i in [from,to]
// proposedTotal() = sum of state.categoryPlans[cat] over all cats
// (the FY27 Proposed total; recompute it on
// blur/Continue, not on every keystroke — see
// the scope-cut note above)
// fmtM(v) -> '€' + (v>=1000 ? (v/1000).toFixed(2)+'M' : round(v)+'K'), with
// a leading minus sign (−) for negative v
// fmtPct(v) -> signed percent, one decimal, using − for negative
// fmtSignedM(v) -> signed €, but the SIGN IS FLIPPED versus fmtPct: positive v
// renders with '−', negative v renders with '+' (see the worked
// example further down, next to the variance-bar formula)
//
// FY25_ACTUAL_TOTAL = sumCategories('fy25a')
// FY26_FORECAST_TOTAL = sumCategories('fy26f'); FY26_BUDGET_TOTAL = sumCategories('fy26b')
// FY26_SPENT_THROUGH_AUG = sumMonthly('value', 0, 7) (Jan-Aug, indices 0-7)
//
// KPI band is ALWAYS exactly these 5 cards (this is the complete, real FY26
// set — don't invent others, and don't build any other year's set since
// there's no toggle to reach them):
// [1] "Spent Through August" = FY26_SPENT_THROUGH_AUG.
// [2] "Full-Year Forecast" = FY26_FORECAST_TOTAL.
// [3] "FY26 Budget" = FY26_BUDGET_TOTAL.
// [4] "Forecast vs Budget" = FY26_BUDGET_TOTAL - FY26_FORECAST_TOTAL,
// favorable if >= 0.
// [5] "YoY vs FY25" = ((FY26_FORECAST_TOTAL - FY25_ACTUAL_TOTAL) /
// FY25_ACTUAL_TOTAL) * 100, favorable if >= 0.
//
// Monthly chart Y-axis — auto-computed from the series below, using this
// exact formula (don't invent your own rounding):
// allVals = every MONTHLY[i].value and MONTHLY[i].budget
// pad = max(20, (max(allVals) - min(allVals)) * 0.2)
// minVal = max(0, floor((min(allVals) - pad) / 50) * 50)
// maxVal = ceil((max(allVals) + pad) / 50) * 50
// 5 gridlines/labels, evenly spaced: value at gridline g (0-4, top to
// bottom) = maxVal - (maxVal - minVal) * g / 4
//
// Monthly chart line style: "Actual"/"Forecast"/"Budget" 3-item legend; the
// budget series is always a plain solid lighter line. The main (value)
// series is drawn as two path segments: solid from index 0 (Jan) to index 7
// (Aug), then dashed from index 7 (Aug) to index 11 (Dec) — note both
// segments include index 7, so they share the Aug point and there's no
// visual gap at the handoff. Data points render as a small filled circle
// normally, or a hollow circle (outline only) on any month where the main
// series' value exceeds that month's budget.
//
// Category variance rows (plain list — no donut/pie): amounts[cat] =
// CATEGORY_ANNUAL[cat].fy26f, compare[cat] = CATEGORY_ANNUAL[cat].fy26b;
// v = compare[cat] - amounts[cat] (positive = favorable/under). Sort however
// reads best (e.g. by amount desc).
// Worked check so you don't have to re-derive the sign convention: Campaigns
// & paid media — compare=fy26b=1080, amounts=fy26f=1050, so v = 1080-1050 =
// +30 (favorable) -> fmtSignedM renders this as "−€30K" (the minus sign here
// means "under budget," not "negative value").
//
// EXACT bar-width formula (this is the part that takes the longest to
// reverse-engineer from the screenshot alone, so don't re-derive it, use this):
// maxAbs = max(|compare[c] - amounts[c]|) over ALL categories, not just this row
// widthPct = max(4, (|v| / maxAbs) * 100) // 4% floor so a ~0 row still shows a sliver
// Favorable rows (v >= 0) render the fill as a solid color; unfavorable rows
// (v < 0) render it as a 45deg diagonal hatch (repeating-linear-gradient,
// 4px stripe/4px gap, same ink color) instead of solid — that hatch pattern
// is not optional decoration, it's how "over" rows are visually distinguished
// from "under" rows since both use the same base color.
//
// Wizard is 2 steps (Baseline review -> Plan by category + submit). There is
// no Strategic-initiatives step and no separate review/waterfall step; the
// overage vs FY27_TARGET (proposedTotal() - FY27_TARGET) is shown as a simple
// KPI/status line on step 2 itself (status "within" if overage <= 0, "warn"
// if overage <= 2% of target, else "over") without any chart.
//
// Quarterly totals (for Step-2 per-quarter amounts — NOT for a simulation
// mini-bar chart, that visualization is cut, see the scope-cut note above):
// qAmount[cat][q] = categoryPlans[cat] * quarterly[cat][q] / 100 (a client-
// side demo shortcut — the real quarterly split should be its own editable
// input per the model spec, not a scaled read of the annual total).
// Trust these numbers and formulas as-is — don't re-derive or invent your own.
// This extends to everything just above too: the KPI-card values, the
// Y-axis gridline values, and the variance bar widths are all mechanical
// outputs of the formulas already given. Implement the formulas and trust
// the result — you don't need to hand-check the resulting numbers against
// the screenshot's pixels before moving on, that verification pass has
// already been done once so it doesn't need repeating.
```
If instead Question 1 redirected this to a meaningfully different tool, or Question 2 pointed to real Pigment data, this dataset doesn't apply — build whatever the real answers call for. ## Visual style — Swiss-brutalist theme
Use these exact tokens for the build, regardless of what the final data/use-case turns out to be. **Fonts**: the source tries to load `Archivo`, `Archivo Black`, and `Geist` from Google Fonts — do not attempt to fetch or embed any of them (no network access in this sandboxed environment). Use system stacks only: display/headline `"Arial Black", Arial, sans-serif` (bold, condensed-feeling, uppercase); body/label `-apple-system, BlinkMacSystemFont, "Helvetica Neue", Arial, sans-serif` for everything else, including the small uppercase "head" labels (section titles, column headers, buttons, chips). **Icons** — verbatim hand-drawn SVG path markup from the source (16x16 viewBox, 1.5px stroke, `currentColor`), reuse as-is via `<svg width="{size}" height="{size}" viewBox="0 0 16 16" fill="none">{path}</svg>`:
```html
<!-- donut (kept only as the small section-header icon for "category breakdown" — the breakdown itself is a plain row list, not an actual donut chart) -->
<circle cx="8" cy="8" r="5.5" stroke="currentColor" stroke-width="1.5" fill="none"/><path d="M8 2.5A5.5 5.5 0 0 1 13.5 8" stroke="currentColor" stroke-width="1.5" fill="none" stroke-linecap="round"/> <!-- bars -->
<path d="M3 13V8M8 13V3M13 13V6" stroke="currentColor" stroke-width="1.5" stroke-linecap="round" stroke-linejoin="round" fill="none"/> <!-- line (trend) -->
<path d="M2.5 11l3-3 2.5 2 4.5-6" stroke="currentColor" stroke-width="1.5" stroke-linecap="round" stroke-linejoin="round" fill="none"/><path d="M2.5 13.5h11" stroke="currentColor" stroke-width="1.5" stroke-linecap="round" fill="none" opacity="0.35"/> <!-- list -->
<path d="M5.5 4.5h8M5.5 8h8M5.5 11.5h8" stroke="currentColor" stroke-width="1.5" stroke-linecap="round" fill="none"/><circle cx="2.5" cy="4.5" r="0.9" fill="currentColor"/><circle cx="2.5" cy="8" r="0.9" fill="currentColor"/><circle cx="2.5" cy="11.5" r="0.9" fill="currentColor"/> <!-- flag -->
<path d="M4 13.5V2.5" stroke="currentColor" stroke-width="1.5" stroke-linecap="round" fill="none"/><path d="M4 3h7.5l-2 2.5 2 2.5H4" stroke="currentColor" stroke-width="1.5" stroke-linejoin="round" fill="none"/> <!-- warning -->
<path d="M8 6v3.2" stroke="currentColor" stroke-width="1.5" stroke-linecap="round"/><circle cx="8" cy="11.3" r="0.9" fill="currentColor"/><path d="M6.8 2.9a1.4 1.4 0 0 1 2.4 0l5 8.6A1.4 1.4 0 0 1 13 13.7H3a1.4 1.4 0 0 1-1.2-2.2z" stroke="currentColor" stroke-width="1.5" stroke-linejoin="round" fill="none"/> <!-- arrow-right -->
<path d="M3 8h10M9 4l4 4-4 4" stroke="currentColor" stroke-width="1.5" stroke-linecap="round" stroke-linejoin="round" fill="none"/> <!-- target -->
<circle cx="8" cy="8" r="5.5" stroke="currentColor" stroke-width="1.5" fill="none"/><circle cx="8" cy="8" r="2.5" stroke="currentColor" stroke-width="1.5" fill="none"/><circle cx="8" cy="8" r="0.8" fill="currentColor"/> <!-- check -->
<path d="M3.5 8.5l3 3 6-7" stroke="currentColor" stroke-width="1.5" stroke-linecap="round" stroke-linejoin="round" fill="none"/>
``` **Design tokens — exact values, machine-readable**:
```js
var TOKENS = { color: { paper: '#F2EFE2', paper2: '#E7E4D3', paper3: '#DCD8C2', // page/card backgrounds, palest to mid ink: '#0E563A', // the ONE accent — doubles as "black" (borders, text, fills) in this palette mid: '#48795B', faint: '#8FAE97', line: '#BECBB6', // Category variance-row palette (used for small swatches next to each row), darkest to lightest (7 categories): categoryColors: ['#09402B', '#0E563A', '#2F6F51', '#538868', '#79A283', '#A1C0A6', '#C8DCC8'], textPrimary: 'var(ink)', textSecondary: 'var(mid)', textDisabled: 'var(faint)', border: 'var(ink)', // Inverted "banner" surface (submission banner, submitted-state fills): ink background, paper text. bannerBg: 'var(ink)', bannerText: 'var(paper)' }, // typography[role] = [size, weight, lineHeight, color] — "display" font is // the bold uppercase headline face, "head" is the small uppercase label // face (letter-spacing ~0.08-0.14em), "body" is plain sentence-case copy. typography: { screenTitle: ['clamp(44px,7vw,92px)', 400, '0.95', 'ink'], // display, uppercase contentTitle: ['26px', 400, '32px', 'ink'], // display, uppercase sectionLabel: ['13px', 700, '20px', 'ink'], // head, uppercase, tracking 0.1em columnLabel: ['10px', 600, '14px', 'textSecondary'], // head, uppercase, tracking 0.14em figure: ['32px', 400, '38px', 'ink'], // display, tabular-nums body: ['14px', 400, '20px', 'textPrimary'], bodyHeavy: ['14px', 600, '20px', 'textPrimary'], small: ['12px', 400, '16px', 'textSecondary'], smallHeavy: ['12px', 600, '16px', 'textPrimary'], legal: ['9px', 600, '12px', 'textSecondary'] // head, uppercase, tracking 0.1em }, radius: { none: '0px' }, // hard corners everywhere — no rounding on any card, button, chip, or input spacing: { s1: '4px', s2: '8px', s3: '12px', s4: '16px', s6: '24px', s8: '32px' }, border: { hairline: '1px solid ink', heavy: '2px solid ink' }, // grid rules between panels are 1px "ink" lines, no drop shadows anywhere shadow: { none: 'none', focusRing: '0 0 0 2px paper, 0 0 0 4px ink' }, motion: { snappy: '120ms linear', soft: '160ms linear' }
};
```
Layout: a single hairline-bordered column (max-width ~1320px) with a 1px "ink" rule between every stacked panel and a matching 1px border down the left/right edge of the whole page — the classic Swiss-grid look. KPI cards sit in a tight grid separated by 1px ink gutters (not gaps+radius+shadow). Buttons/segments/chips use `box-shadow: inset 0 0 0 2px ink` instead of a border, so the outline never shifts layout. All-caps, tracked-out labels throughout; no shadows, no rounding, one accent color doing all the work. ## Quality bar
No console errors. Whatever data source we land on, keep every panel — KPI band, monthly chart, category variance rows, major-expenses list, and both wizard steps — deriving from the same underlying values so nothing contradicts on screen (e.g. the FY27 Proposed total shown on the overview banner must match the wizard's last-recomputed total exactly). Clean up all listeners/timers/DOM (including the resize/intersection observers and scramble/flip timers) the frame added when re-mounted.
Download this image. Attach it to the Modeler Agent chat to guide the Frame’s design.
Download this image. Attach it to the Modeler Agent chat to guide the Frame’s design.
Explore an inventory stress-test Frame built in Pigment. Dial in demand swings and supplier delays, and watch stockout risk, weeks of cover, and incoming supply recalculate live. See it in action.
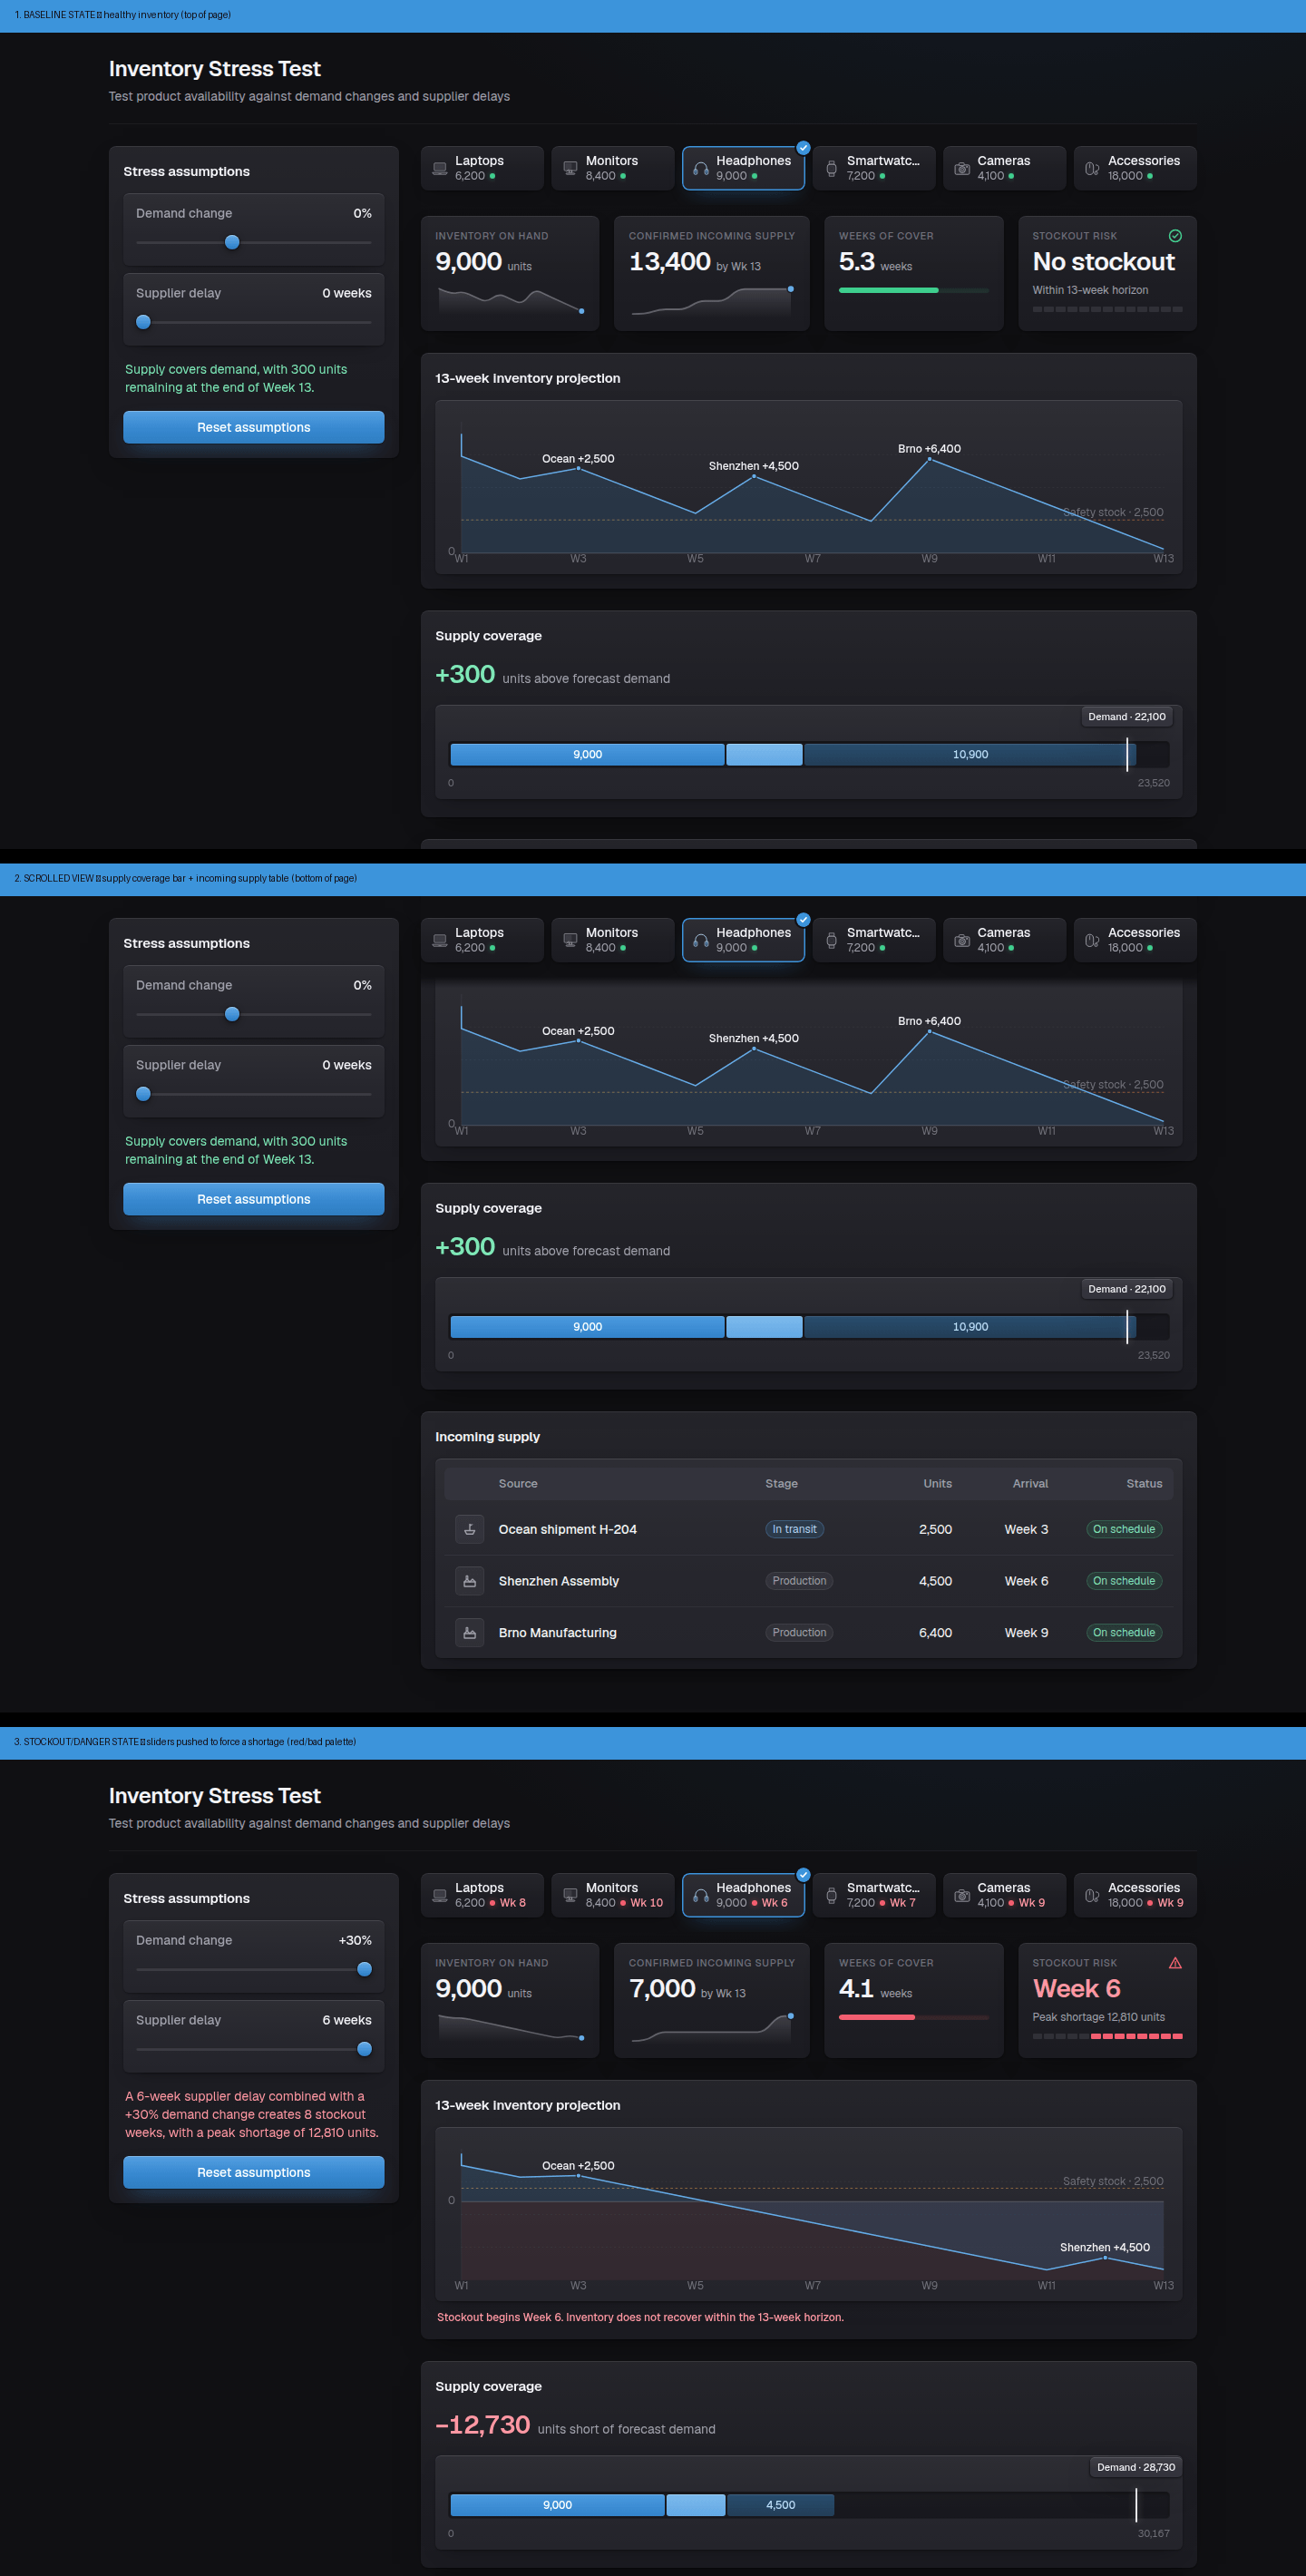
What to do:
Open and copy the prompt for this Frame. Paste it into the Modeler Agent chat.
Open and copy the prompt for this Frame. Paste it into the Modeler Agent chat.
Before building anything, ask me a few quick questions — one at a time, wait for my answer before asking the next one. Don't write any code or create anything until we're through all of them. Use the AskUser card to ask each question. **Question 1**: The attached screenshot is an inventory what-if tool — pick a product, drag two sliders (demand change, supplier delay), see if/when it runs out of stock over the next 13 weeks. Ask me simply: *"Does this use case match your intent, or were you picturing something a bit different?"* If I say something different, ask me to describe it in a sentence or two and go with that instead of the screenshot's version. **Question 2**: Ask me: *"Should I use made-up demo numbers for now, or hook this up to real data you already have in Pigment?"* **Question 3** (only if I said "real data" in Question 2): Ask me: *"Which List, Metric, or Table should it use?"* Wait for me to name it — don't guess or invent names. **Question 4** (only if I said "made-up demo numbers" in Question 2): Ask me: *"Want me to just fake it for now, or actually set up real Lists/Metrics for this later?"* If I want it set up for real, ask where (which Application/folder) before creating anything. **Then build it.** Tell me first that building the frame can take up to 10 minutes. Use my answers for what the tool actually does and where its data comes from. For the *look* — colors, dark card layout, fonts, spacing — match the attached screenshot's style exactly, regardless of what we land on for Questions 1–4. **If I said "made-up demo numbers" in Question 2 and the tool is still basically this inventory/stockout idea** (i.e. I didn't redirect it to something substantially different in Question 1), use this exact dataset verbatim instead of inventing your own — it's already internally consistent and screenshot-accurate, so there's no need to make up or tune numbers: ```js
var PRODUCTS = { laptops: { label: 'Laptops', onHand: 6200, weeklyDemand: 720, safetyStock: 1400, shipments: [ { source: 'Taipei shipment L-118', stage: 'in_transit', quantity: 1200, arrivalWeek: 3 }, { source: 'Shenzhen Assembly', stage: 'production', quantity: 2500, arrivalWeek: 7 } ] }, monitors: { label: 'Monitors', onHand: 8400, weeklyDemand: 850, safetyStock: 1600, shipments: [ { source: 'Ningbo shipment M-072', stage: 'in_transit', quantity: 1800, arrivalWeek: 4 }, { source: 'Brno Manufacturing', stage: 'production', quantity: 1500, arrivalWeek: 8 } ] }, headphones: { label: 'Headphones', onHand: 9000, weeklyDemand: 1700, safetyStock: 2500, shipments: [ { source: 'Ocean shipment H-204', stage: 'in_transit', quantity: 2500, arrivalWeek: 3 }, { source: 'Shenzhen Assembly', stage: 'production', quantity: 4500, arrivalWeek: 6 }, { source: 'Brno Manufacturing', stage: 'production', quantity: 6400, arrivalWeek: 9 } ] }, smartwatches: { label: 'Smartwatches', onHand: 7200, weeklyDemand: 1000, safetyStock: 1500, shipments: [ { source: 'Air shipment W-031', stage: 'in_transit', quantity: 1800, arrivalWeek: 4 }, { source: 'Hanoi Assembly', stage: 'production', quantity: 4500, arrivalWeek: 8 } ] }, cameras: { label: 'Cameras', onHand: 4100, weeklyDemand: 420, safetyStock: 800, shipments: [ { source: 'Osaka shipment C-044', stage: 'in_transit', quantity: 600, arrivalWeek: 5 }, { source: 'Nagoya Production', stage: 'production', quantity: 1000, arrivalWeek: 9 } ] }, accessories: { label: 'Accessories', onHand: 18000, weeklyDemand: 1900, safetyStock: 3000, shipments: [ { source: 'Freight shipment A-190', stage: 'in_transit', quantity: 3000, arrivalWeek: 3 }, { source: 'Penang Manufacturing', stage: 'production', quantity: 4500, arrivalWeek: 7 } ] }
};
// Product order: Laptops, Monitors, Headphones, Smartwatches, Cameras, Accessories. Default selected: Headphones.
// 13-week horizon. Demand-change slider (-20% to +30%) scales weeklyDemand for all products. Supplier-delay
// slider (0-6 weeks) shifts only production-stage shipments' arrivalWeek later (never in-transit shipments).
// Trust these numbers as-is — don't re-derive or invent your own.
```
If instead Question 1 redirected this to a meaningfully different tool, or Question 2 pointed to real Pigment data, this dataset doesn't apply — build whatever the real answers call for. ## Visual style — "layered card-in-card" dark theme
Use these exact tokens for the build, regardless of what the final data/use-case turns out to be. **Fonts**: system stacks only — `-apple-system, BlinkMacSystemFont, "Segoe UI", Roboto, "Helvetica Neue", Arial, sans-serif`. Do not attempt to fetch or embed any custom web font (no network access in this environment). **Depth system** — surfaces get progressively lighter as they nest; every raised surface gets a top-edge highlight plus an internal sheen gradient, never a flat fill:
- Ground `bg` `#101013` — a very subtle radial blue glow upper-right: `radial-gradient(1100px 520px at 78% -140px, rgba(60,148,219,0.09), transparent 62%)`.
- Surface 1 `#1B1B21` — top-level cards. Surface 2 `#24242B` — nested cards inside surface-1. Surface 3 `#2B2B33`, Surface 4 `#33333C` — further-nested pop layers (tooltips, floating pills, header bands).
- `--card-face` sheen on every card: `linear-gradient(180deg, rgba(255,255,255,0.045) 0%, rgba(255,255,255,0.01) 55%, rgba(255,255,255,0) 100%)`, layered over its background color as a *separate* `background-image` declaration — never collapse color + sheen into one `background:` shorthand, that silently drops one of the two.
- Card shadow (outer cards): `inset 0 1px 0 rgba(255,255,255,0.09), 0 1px 2px rgba(0,0,0,0.40), 0 12px 32px -16px rgba(0,0,0,0.60)`. Nested cards: `inset 0 1px 0 rgba(255,255,255,0.12), 0 1px 2px rgba(0,0,0,0.30), 0 8px 20px -12px rgba(0,0,0,0.50)`. Floating pop layers: `inset 0 1px 0 rgba(255,255,255,0.14), 0 1px 2px rgba(0,0,0,0.50), 0 12px 32px -8px rgba(0,0,0,0.65)`.
- Corner radius: 8px top-level cards, 6px nested/inner elements. Hairlines: `rgba(255,255,255,0.055)` (row separators), `rgba(255,255,255,0.10)` (section dividers). **Colors**:
- Text: high-emphasis `#F4F4F7`, mid `#A0A0AC`, low `#6F6F7B`.
- Accent (brand blue): base `#3C94DB`, hover/chart-line `#66ADE8`, text-on-dark `#B4D8F5`, soft wash `rgba(60,148,219,0.16)`.
- Semantic triad — every status maps to exactly one, never a raw color: **Good** `#3ECF8E` / `#7FE7B7` text / `rgba(62,207,142,0.12)` bg. **Warn** `#F0B441` / `#FFD48D` / `rgba(240,180,65,0.12)`. **Bad** `#F25E70` / `#FF97A3` / `rgba(242,94,112,0.12)`, plus `rgba(242,94,112,0.07)` full-card wash for danger context.
- Focus ring: `0 0 0 3px rgba(60,148,219,0.35)`. **Typography** (size / weight / line-height / letter-spacing / color):
| Role | Size | Weight | Line-height | Letter-spacing | Color |
|---|---|---|---|---|---|
| Screen title | 24px | 600 | 32px | -0.02em | text-hi |
| Section title (card headers) | 15px | 600 | 24px | -0.01em | text-hi |
| Kicker (uppercase label) | 11px | 500 | 16px | 0.7px, uppercase | text-low |
| Column title (table headers) | 13px | 500 | 16px | — | text-mid |
| Highlight figure (big number) | 28px | 600 | 36px | -0.02em | text-hi (or bad-text in a danger context), tabular-nums |
| Running regular (body) | 14px | 400 | 20px | — | text-hi |
| Running heavy (emphasized body) | 14px | 500 | 20px | — | text-hi, tabular-nums |
| Running small | 12px | 400 | 16px | — | text-mid |
| Field label | 14px | 500 | 20px | — | text-mid | **Components**: pill buttons/chips fully rounded (5000px radius), sliders are a thin 4px recessed track with a 16px gradient thumb (`#66ADE8` → `#2F7EC2`), primary buttons use a rich vertical blue gradient (`#549FE1` → `#3789CF` → `#2F7EC2`) with a soft ambient glow shadow, hover brightens ~1.07, active presses 1px + dims. Generic top-level card padding `16px` all sides unless a specific component clearly needs tighter padding for its content (in which case pick something deliberately, don't default to the generic value everywhere). ## Quality bar
No console errors. Whatever data source we land on, keep every panel deriving from the same underlying values so nothing contradicts on screen. Clean up all listeners/timers/DOM the frame added when re-mounted.
Download this image. Attach it to the Modeler Agent chat to guide the Frame’s design.
Download this image. Attach it to the Modeler Agent chat to guide the Frame’s design.
Explore a workforce planning Frame built in Pigment. Drag positions across a hiring timeline and watch quarterly budget, department cost, and in-year spend recalculate instantly. See it in action.
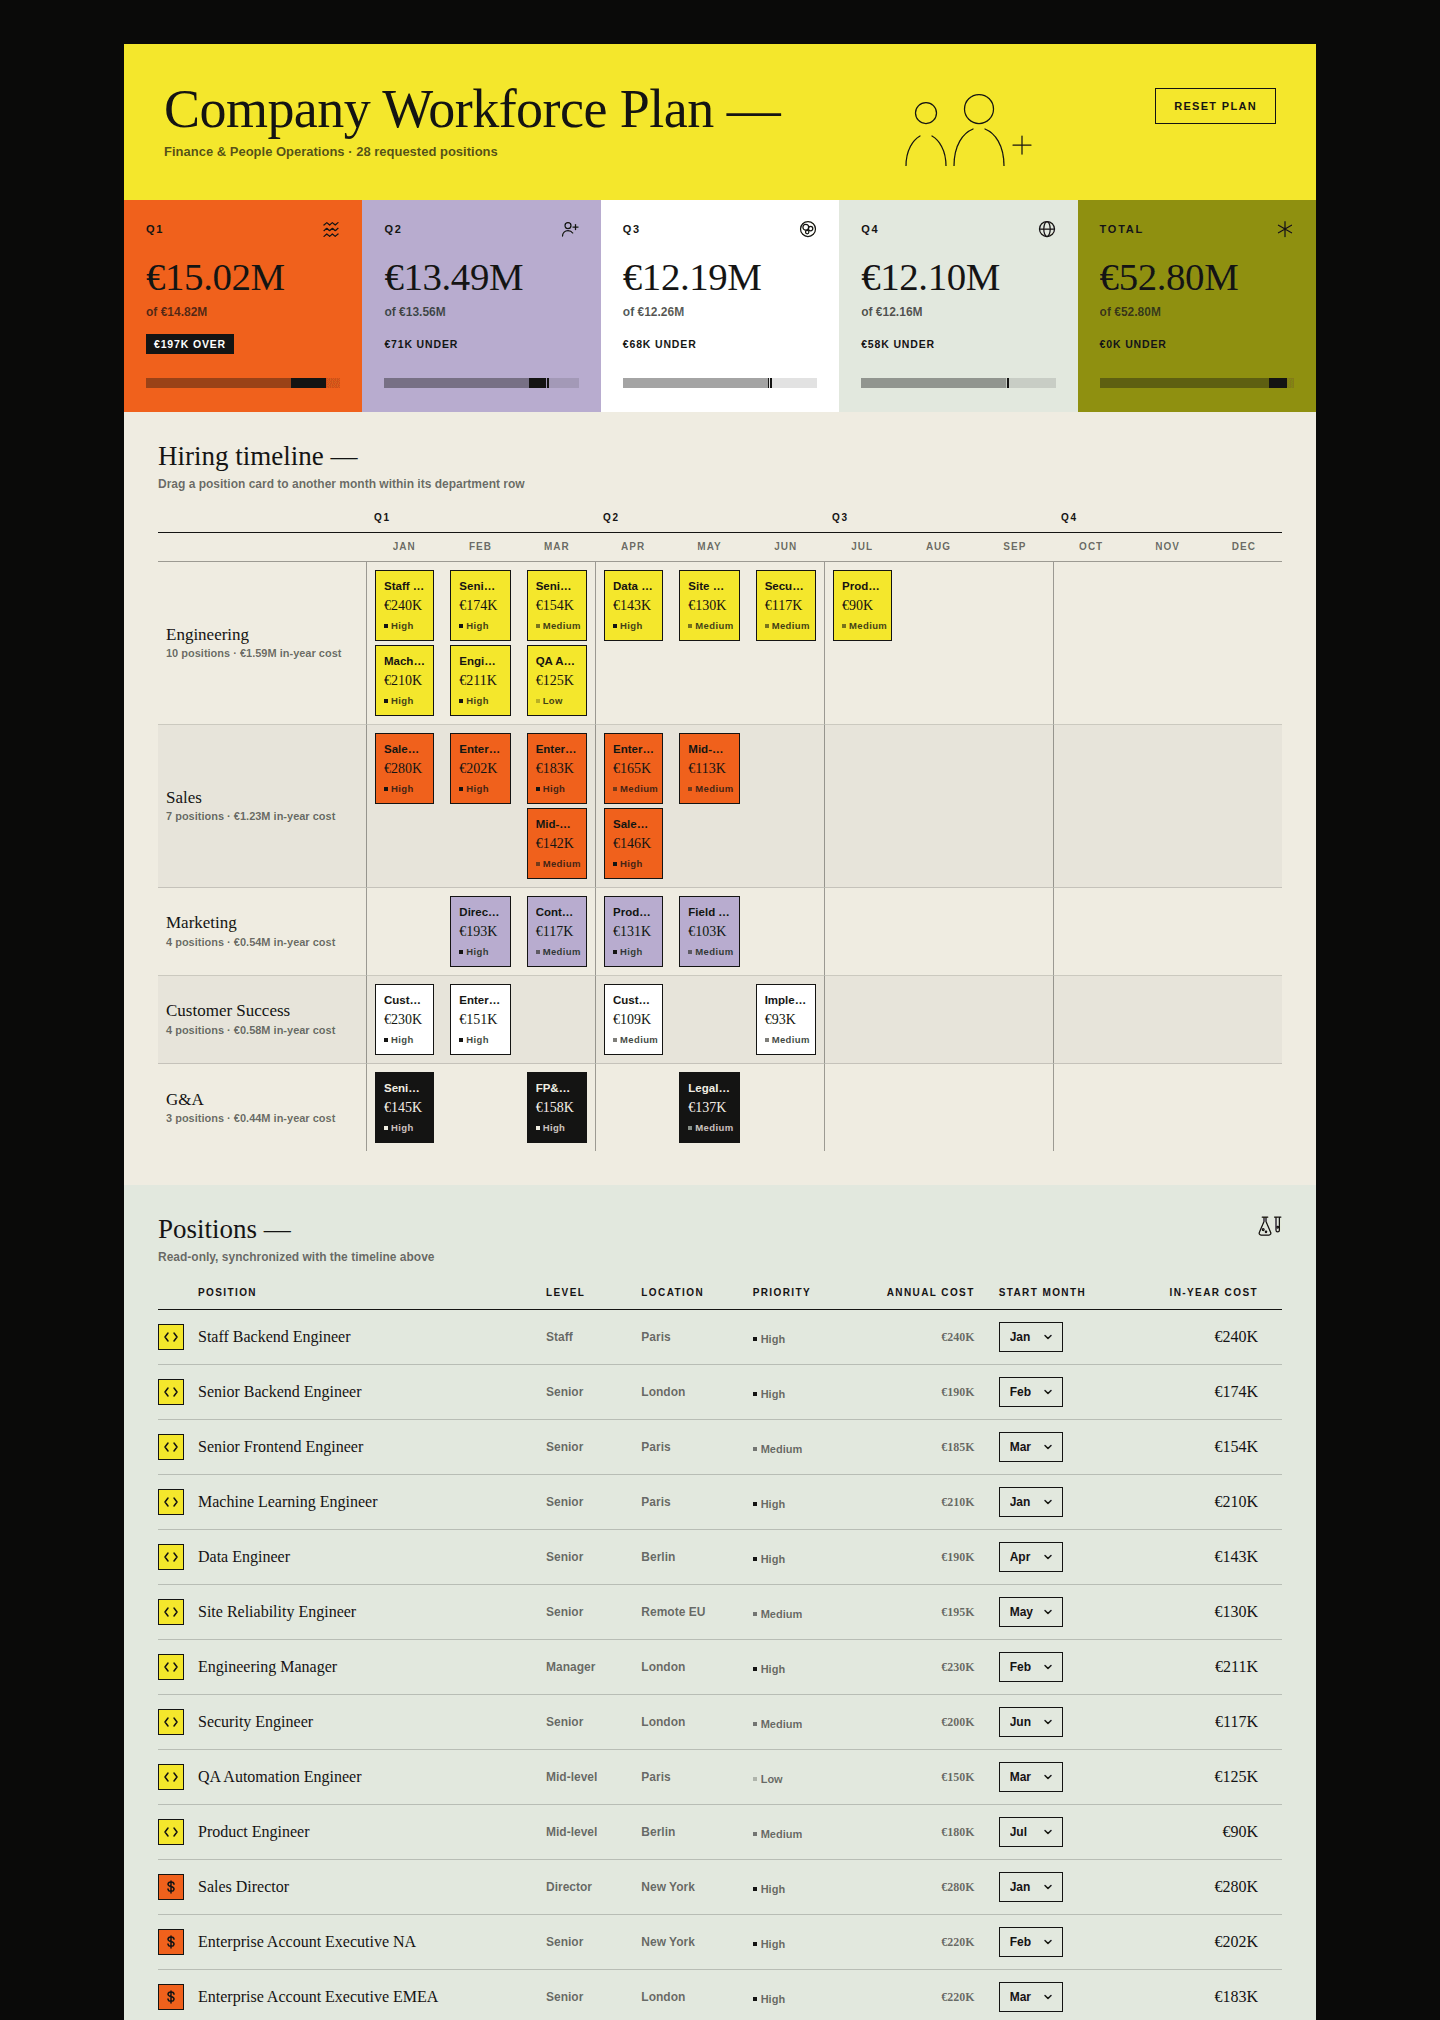
What to do:
Open and copy the prompt for this Frame. Paste it into the Modeler Agent chat.
Open and copy the prompt for this Frame. Paste it into the Modeler Agent chat.
Before building anything, ask me a few quick questions — one at a time, wait for my answer before asking the next one. Don't write any code or create anything until we're through all of them. Use the AskUser card to ask each question. **Question 1**: The attached screenshot is an FY27 workforce hiring plan — a KPI band (planned workforce cost vs. budget, variance, headcount) sits above a quarterly budget-vs-planned row (four/five color-block tiles, one per quarter, each showing existing cost, newly planned cost, and budget headroom or overage) and a department cost breakdown, with a draggable roster of open positions (as cards or table rows) that can be moved between quarters/start months to see the budget respond live. Ask me simply: *"Does this use case match your intent, or were you picturing something a bit different?"* If I say something different, ask me to describe it in a sentence or two and go with that instead of the screenshot's version. **Question 2**: Ask me: *"Should I use made-up demo numbers for now, or hook this up to real data you already have in Pigment?"* **Question 3** (only if I said "real data" in Question 2): Ask me: *"Which List, Metric, or Table should it use?"* Wait for me to name it — don't guess or invent names. **Question 4** (only if I said "made-up demo numbers" in Question 2): Ask me: *"Want me to just fake it for now, or actually set up real Lists/Metrics for this later?"* If I want it set up for real, ask where (which Application/folder) before creating anything. **Then build it.** Tell me first that building the frame can take up to 10 minutes. Before writing any code, open and actually look at the attached screenshot — every panel, including the quarterly tiles and the position roster. Skipping this step is the single biggest cause of a wrong build (and a wrong build is far slower to fix than reading the image once up front). Use my answers for what the tool actually does and where its data comes from. For the *look* — colors, card layout, fonts, spacing — match the attached screenshot's style exactly, regardless of what we land on for Questions 1–4. Write the Frame in one file pass — assemble the full body and write it once (or in 2–3 large passes at most), not as many small incremental edits. The dataset and design tokens below are for you to wire directly into the code; reference them by name in your own response rather than re-pasting the full arrays/objects back — restating them adds length without adding anything I need to review. **If I said "made-up demo numbers" in Question 2 and the tool is still basically this hiring-plan idea** (i.e. I didn't redirect it to something substantially different in Question 1), use this exact dataset verbatim instead of inventing your own — it's already internally consistent and screenshot-accurate, so there's no need to make up or tune numbers: ```js
// All monetary constants are in millions of EUR except individual position
// annualCost, which is in thousands of EUR.
var MODEL = { workforceBudget: 52.8, // FY27 Workforce Budget, €M existingWorkforceCost: 48.408333, // Existing Workforce Cost, FY27, €M // Each quarter's cost is the existing baseline (existingWorkforceCost / 4) // plus whatever new positions start in that quarter (see calculatePlan // below) — so dragging a position between quarters directly changes that // quarter's total. The four figures sum to exactly workforceBudget. quarterlyBudget: [14.82, 13.56, 12.26, 12.16] // Q1-Q4 Budget, €M
}; var MONTHS = ['Jan','Feb','Mar','Apr','May','Jun','Jul','Aug','Sep','Oct','Nov','Dec'];
var QUARTERS = [ { label: 'Q1', months: [1, 2, 3] }, { label: 'Q2', months: [4, 5, 6] }, { label: 'Q3', months: [7, 8, 9] }, { label: 'Q4', months: [10, 11, 12] }
]; var DEPARTMENTS = [ { name: 'Engineering', fg: '#141413', bg: '#f4e72c', icon: 'M5 4L2 8l3 4M11 4l3 4-3 4' }, { name: 'Sales', fg: '#141413', bg: '#f0611c', icon: 'M8 2v12M11 5.3c0-1.3-1.4-2.3-3-2.3S5 3.9 5 5.3s1.3 1.9 3 2.3 3 1 3 2.4-1.4 2.3-3 2.3-3-1-3-2.3' }, { name: 'Marketing', fg: '#141413', bg: '#b8accf', icon: 'M2 6.3v3.4a1 1 0 001 1h1l5 2.5V2.8L4 5.3H3a1 1 0 00-1 1z M11.5 6c.9.5 1.5 1.2 1.5 2s-.6 1.5-1.5 2' }, { name: 'Customer Success', fg: '#141413', bg: '#ffffff', icon: 'M8 13.3S2.2 9.8 2.2 6.1C2.2 4.2 3.7 3 5.4 3c1 0 1.9.5 2.6 1.4C8.7 3.5 9.6 3 10.6 3c1.7 0 3.2 1.2 3.2 3.1 0 3.7-5.8 7.2-5.8 7.2z' }, { name: 'G&A', fg: '#f4f1e6', bg: '#141413', iconViewBox: '0 0 24 24', icon: 'M14.7 6.3a1 1 0 000 1.4l1.6 1.6a1 1 0 001.4 0l3.77-3.77a6 6 0 01-7.94 7.94l-6.91 6.91a2.12 2.12 0 01-3-3l6.91-6.91a6 6 0 017.94-7.94l-3.76 3.76z' }
]; // Position `id` (e.g. "eng-01") is the unique row key — job titles like
// "Senior Backend Engineer" are NOT unique (two reqs, same title, different
// location, is a normal real case). Location also repeats across rows and
// is a slicing axis just like department.
var INITIAL_POSITIONS = [ { id: 'eng-01', name: 'Staff Backend Engineer', department: 'Engineering', level: 'Staff', location: 'Paris', priority: 'High', annualCost: 240, startMonth: 1 }, { id: 'eng-02', name: 'Senior Backend Engineer', department: 'Engineering', level: 'Senior', location: 'London', priority: 'High', annualCost: 190, startMonth: 2 }, { id: 'eng-03', name: 'Senior Frontend Engineer', department: 'Engineering', level: 'Senior', location: 'Paris', priority: 'Medium', annualCost: 185, startMonth: 3 }, { id: 'eng-04', name: 'Machine Learning Engineer', department: 'Engineering', level: 'Senior', location: 'Paris', priority: 'High', annualCost: 210, startMonth: 1 }, { id: 'eng-05', name: 'Data Engineer', department: 'Engineering', level: 'Senior', location: 'Berlin', priority: 'High', annualCost: 190, startMonth: 4 }, { id: 'eng-06', name: 'Site Reliability Engineer', department: 'Engineering', level: 'Senior', location: 'Remote EU', priority: 'Medium', annualCost: 195, startMonth: 5 }, { id: 'eng-07', name: 'Engineering Manager', department: 'Engineering', level: 'Manager', location: 'London', priority: 'High', annualCost: 230, startMonth: 2 }, { id: 'eng-08', name: 'Security Engineer', department: 'Engineering', level: 'Senior', location: 'London', priority: 'Medium', annualCost: 200, startMonth: 6 }, { id: 'eng-09', name: 'QA Automation Engineer', department: 'Engineering', level: 'Mid-level', location: 'Paris', priority: 'Low', annualCost: 150, startMonth: 3 }, { id: 'eng-10', name: 'Product Engineer', department: 'Engineering', level: 'Mid-level', location: 'Berlin', priority: 'Medium', annualCost: 180, startMonth: 7 }, { id: 'sales-01', name: 'Sales Director', department: 'Sales', level: 'Director', location: 'New York', priority: 'High', annualCost: 280, startMonth: 1 }, { id: 'sales-02', name: 'Enterprise Account Executive NA', department: 'Sales', level: 'Senior', location: 'New York', priority: 'High', annualCost: 220, startMonth: 2 }, { id: 'sales-03', name: 'Enterprise Account Executive EMEA', department: 'Sales', level: 'Senior', location: 'London', priority: 'High', annualCost: 220, startMonth: 3 }, { id: 'sales-04', name: 'Enterprise Account Executive APAC', department: 'Sales', level: 'Senior', location: 'Singapore', priority: 'Medium', annualCost: 220, startMonth: 4 }, { id: 'sales-05', name: 'Mid-market Account Executive NA', department: 'Sales', level: 'Mid-level', location: 'New York', priority: 'Medium', annualCost: 170, startMonth: 3 }, { id: 'sales-06', name: 'Mid-market Account Executive EMEA', department: 'Sales', level: 'Mid-level', location: 'Paris', priority: 'Medium', annualCost: 170, startMonth: 5 }, { id: 'sales-07', name: 'Sales Engineer', department: 'Sales', level: 'Senior', location: 'London', priority: 'High', annualCost: 195, startMonth: 4 }, { id: 'mkt-01', name: 'Director of Demand Generation', department: 'Marketing', level: 'Director', location: 'New York', priority: 'High', annualCost: 210, startMonth: 2 }, { id: 'mkt-02', name: 'Product Marketing Manager', department: 'Marketing', level: 'Senior', location: 'Paris', priority: 'High', annualCost: 175, startMonth: 4 }, { id: 'mkt-03', name: 'Content Marketing Manager', department: 'Marketing', level: 'Mid-level', location: 'London', priority: 'Medium', annualCost: 140, startMonth: 3 }, { id: 'mkt-04', name: 'Field Marketing Manager', department: 'Marketing', level: 'Mid-level', location: 'Singapore', priority: 'Medium', annualCost: 155, startMonth: 5 }, { id: 'cs-01', name: 'Customer Success Director', department: 'Customer Success', level: 'Director', location: 'New York', priority: 'High', annualCost: 230, startMonth: 1 }, { id: 'cs-02', name: 'Enterprise Customer Success Manager', department: 'Customer Success', level: 'Senior', location: 'London', priority: 'High', annualCost: 165, startMonth: 2 }, { id: 'cs-03', name: 'Customer Success Manager', department: 'Customer Success', level: 'Mid-level', location: 'Paris', priority: 'Medium', annualCost: 145, startMonth: 4 }, { id: 'cs-04', name: 'Implementation Consultant', department: 'Customer Success', level: 'Senior', location: 'Berlin', priority: 'Medium', annualCost: 160, startMonth: 6 }, { id: 'ga-01', name: 'FP&A Manager', department: 'G&A', level: 'Manager', location: 'Paris', priority: 'High', annualCost: 190, startMonth: 3 }, { id: 'ga-02', name: 'Senior Recruiter', department: 'G&A', level: 'Senior', location: 'London', priority: 'High', annualCost: 145, startMonth: 1 }, { id: 'ga-03', name: 'Legal Counsel', department: 'G&A', level: 'Senior', location: 'Paris', priority: 'Medium', annualCost: 205, startMonth: 5 }
]; // Calculation model (per position):
// inYearCostK = position.annualCost * (13 - position.startMonth) / 12
// (full annual cost is pro-rated by however many months remain in FY27
// starting from startMonth — a Jan start counts 12 months, a Dec start 1)
//
// newPositionCostM = sum of inYearCostK over all positions / 1000
// plannedWorkforceCost = existingWorkforceCost + newPositionCostM
// budgetVariance = workforceBudget - plannedWorkforceCost
//
// byDepartment[dept] = { count, costK } rolled up from positions in that dept
//
// Per quarter (existingM = existingWorkforceCost / 4, split flat across all
// four quarters):
// plannedM = sum of inYearCostK for positions whose startMonth falls in
// that quarter's months, / 1000
// total = existingM + plannedM
// (compare total against quarterlyBudget[quarterIndex] for over/under)
//
// A position's FULL in-year cost is attributed to the quarter it starts in
// (not spread through December) — that's what makes dragging a card between
// quarters/months immediately and fully move that quarter's total.
// Trust these numbers and formulas as-is — don't re-derive or invent your own.
```
If instead Question 1 redirected this to a meaningfully different tool, or Question 2 pointed to real Pigment data, this dataset doesn't apply — build whatever the real answers call for. ## Visual style — "colorful blocks" editorial theme
Use these exact tokens for the build, regardless of what the final data/use-case turns out to be. **Fonts**: the source tries to load `'Old Standard TT'` (serif, headings) and `'Manrope'` (sans, body/UI) from Google Fonts — do not attempt to fetch or embed either (no network access in this sandboxed environment). Use system stacks only: serif `Georgia, "Times New Roman", serif`; sans `-apple-system, BlinkMacSystemFont, "Helvetica Neue", Arial, sans-serif`. **Icons** — verbatim hand-drawn SVG markup from the source, reuse as-is:
```html
<!-- Engineering department icon (path only; drop into a 16x16 viewBox svg) -->
<path d="M5 4L2 8l3 4M11 4l3 4-3 4"/> <!-- Sales department icon -->
<path d="M8 2v12M11 5.3c0-1.3-1.4-2.3-3-2.3S5 3.9 5 5.3s1.3 1.9 3 2.3 3 1 3 2.4-1.4 2.3-3 2.3-3-1-3-2.3"/> <!-- Marketing department icon -->
<path d="M2 6.3v3.4a1 1 0 001 1h1l5 2.5V2.8L4 5.3H3a1 1 0 00-1 1z M11.5 6c.9.5 1.5 1.2 1.5 2s-.6 1.5-1.5 2"/> <!-- Customer Success department icon -->
<path d="M8 13.3S2.2 9.8 2.2 6.1C2.2 4.2 3.7 3 5.4 3c1 0 1.9.5 2.6 1.4C8.7 3.5 9.6 3 10.6 3c1.7 0 3.2 1.2 3.2 3.1 0 3.7-5.8 7.2-5.8 7.2z"/> <!-- G&A department icon (viewBox 0 0 24 24, all others 0 0 16 16) -->
<path d="M14.7 6.3a1 1 0 000 1.4l1.6 1.6a1 1 0 001.4 0l3.77-3.77a6 6 0 01-7.94 7.94l-6.91 6.91a2.12 2.12 0 01-3-3l6.91-6.91a6 6 0 017.94-7.94l-3.76 3.76z"/>
<!-- Department icons render as: <svg width="16" height="16" viewBox="{iconViewBox||'0 0 16 16'}" fill="none" stroke="currentColor" stroke-width="1.5" stroke-linecap="round" stroke-linejoin="round"><path d="{icon}"/></svg> --> <!-- Header illustration ("people") -->
<svg width="140" height="84" viewBox="0 0 140 84" fill="none" stroke="currentColor" stroke-width="1.25" stroke-linecap="round" stroke-linejoin="round"><circle cx="28" cy="31" r="10.5"/><path d="M8 84C8 68 15 58 22 54M48 84C48 68 41 58 34 54"/><circle cx="81" cy="27" r="14.5"/><path d="M56 84C56 63 65 51 75 47M106 84C106 63 97 51 87 47"/><path d="M124 54v18M115 63h18"/></svg> <!-- Quarter tile icons (Q1-Q4 + Total), 18x18 -->
<svg width="18" height="18" viewBox="0 0 18 18" fill="none" stroke="currentColor" stroke-width="1.25" stroke-linecap="round" stroke-linejoin="round"><path d="M2 5l2.8-2.4 2.8 2.4 2.8-2.4 2.8 2.4 2.8-2.4M2 10.7l2.8-2.4 2.8 2.4 2.8-2.4 2.8 2.4 2.8-2.4M2 16.4L4.8 14l2.8 2.4L10.4 14l2.8 2.4L16 14"/></svg>
<svg width="18" height="18" viewBox="0 0 18 18" fill="none" stroke="currentColor" stroke-width="1.25" stroke-linecap="round" stroke-linejoin="round"><circle cx="7" cy="5.5" r="3"/><path d="M1.5 16c0-3.2 2.4-5.4 5.5-5.4 2 0 3.7.9 4.7 2.4M14.5 4.5v5M12 7h5"/></svg>
<svg width="18" height="18" viewBox="0 0 18 18" fill="none" stroke="currentColor" stroke-width="1.25" stroke-linecap="round" stroke-linejoin="round"><circle cx="9" cy="9" r="7.5"/><circle cx="6.8" cy="7.2" r="2.9"/><circle cx="11.6" cy="8.6" r="2.2"/><circle cx="8.2" cy="12.1" r="1.7"/></svg>
<svg width="18" height="18" viewBox="0 0 18 18" fill="none" stroke="currentColor" stroke-width="1.25" stroke-linecap="round" stroke-linejoin="round"><circle cx="9" cy="9" r="7.5"/><ellipse cx="9" cy="9" rx="3.2" ry="7.5"/><path d="M1.5 9h15"/></svg>
<svg width="18" height="18" viewBox="0 0 18 18" fill="none" stroke="currentColor" stroke-width="1.25" stroke-linecap="round" stroke-linejoin="round"><path d="M9 1.5v15M2.5 5.25l13 7.5M15.5 5.25l-13 7.5"/></svg>
``` **Design tokens — exact values, machine-readable**:
```js
var TOKENS = { color: { ink: '#141413', ink72: 'rgba(20,20,19,0.72)', ink62: 'rgba(20,20,19,0.62)', hairline: 'rgba(20,20,19,0.38)', hairlineSoft: 'rgba(20,20,19,0.16)', mat: '#0a0a09', // page backdrop the color blocks float on // The distinctive "colorful blocks" palette — flush, flat, high-saturation // tiles with no gaps or borders between them: blockYellow: '#f4e72c', blockOrange: '#f0611c', blockLavender: '#b8accf', blockWhite: '#ffffff', blockSage: '#e2e8de', blockCream: '#efece1', blockOlive: '#8f9010', blockBlack: '#141413', textOnBlack: '#f4f1e6', // Department accent pairs (bg tile / fg icon+text), reused on roster rows: department: { Engineering: { fg: '#141413', bg: '#f4e72c' }, Sales: { fg: '#141413', bg: '#f0611c' }, Marketing: { fg: '#141413', bg: '#b8accf' }, 'Customer Success': { fg: '#141413', bg: '#ffffff' }, 'G&A': { fg: '#f4f1e6', bg: '#141413' } }, // Quarter tile fills, in column order Q1..Q4/Total: quarterTileFills: ['#f0611c', '#b8accf', '#ffffff', '#e2e8de', '#8f9010'] }, // typography[role] = [size, weight/family note, lineHeight, color] typography: { heroTitle: ['clamp(34px,4vw,54px)', 400, '1.02', '#141413'], // serif, trailing em-dash appended via ::after heroSubtitle: ['13px', 600, '20px', 'rgba(20,20,19,0.72)'], // sans cardTitle: ['27px', 400, '1.1', '#141413'], // serif, trailing em-dash via ::after cardSubtitle: ['12px', 600, '16px', 'rgba(20,20,19,0.62)'], // sans quarterLabel: ['11px', 800, null, '#141413'], // sans, uppercase, letter-spacing 0.16em buttonLabel: ['11px', 800, '1', '#141413'] // sans, uppercase, letter-spacing 0.12em }, radius: { none: '0px' }, // every block/card/button is hard-cornered, no rounding anywhere spacing: { space1: '4px', space2: '8px', space3: '12px', space4: '16px', space6: '24px', space8: '32px' }, shadow: { pop: '3px 3px 0 rgba(20,20,19,0.85)', // resting drag-card shadow dragged: '8px 8px 0 rgba(20,20,19,0.9)', // shadow while a card is being dragged focusRing: '0 0 0 3px rgba(240,97,28,0.85)' }, motion: { snappy: '150ms ease-in', soft: '200ms ease-in-out' }, overStripes: 'repeating-linear-gradient(135deg, #ffffff 0 3px, #141413 3px 6px)' // decorative diagonal stripe fill used as an accent
};
``` ## Quality bar
No console errors. Whatever data source we land on, keep every panel — KPI band, quarterly tiles, department breakdown, position roster — deriving from the same underlying values so nothing contradicts on screen. Clean up all listeners/timers/DOM the frame added when re-mounted.
Download this image. Attach it to the Modeler Agent chat to guide the Frame’s design.
Download this image. Attach it to the Modeler Agent chat to guide the Frame’s design.
Explore a sales capacity Frame built in Pigment with hiring, quota, and ramp-time assumptions that recalculate live New ARR and team coverage instantly. See it in action.
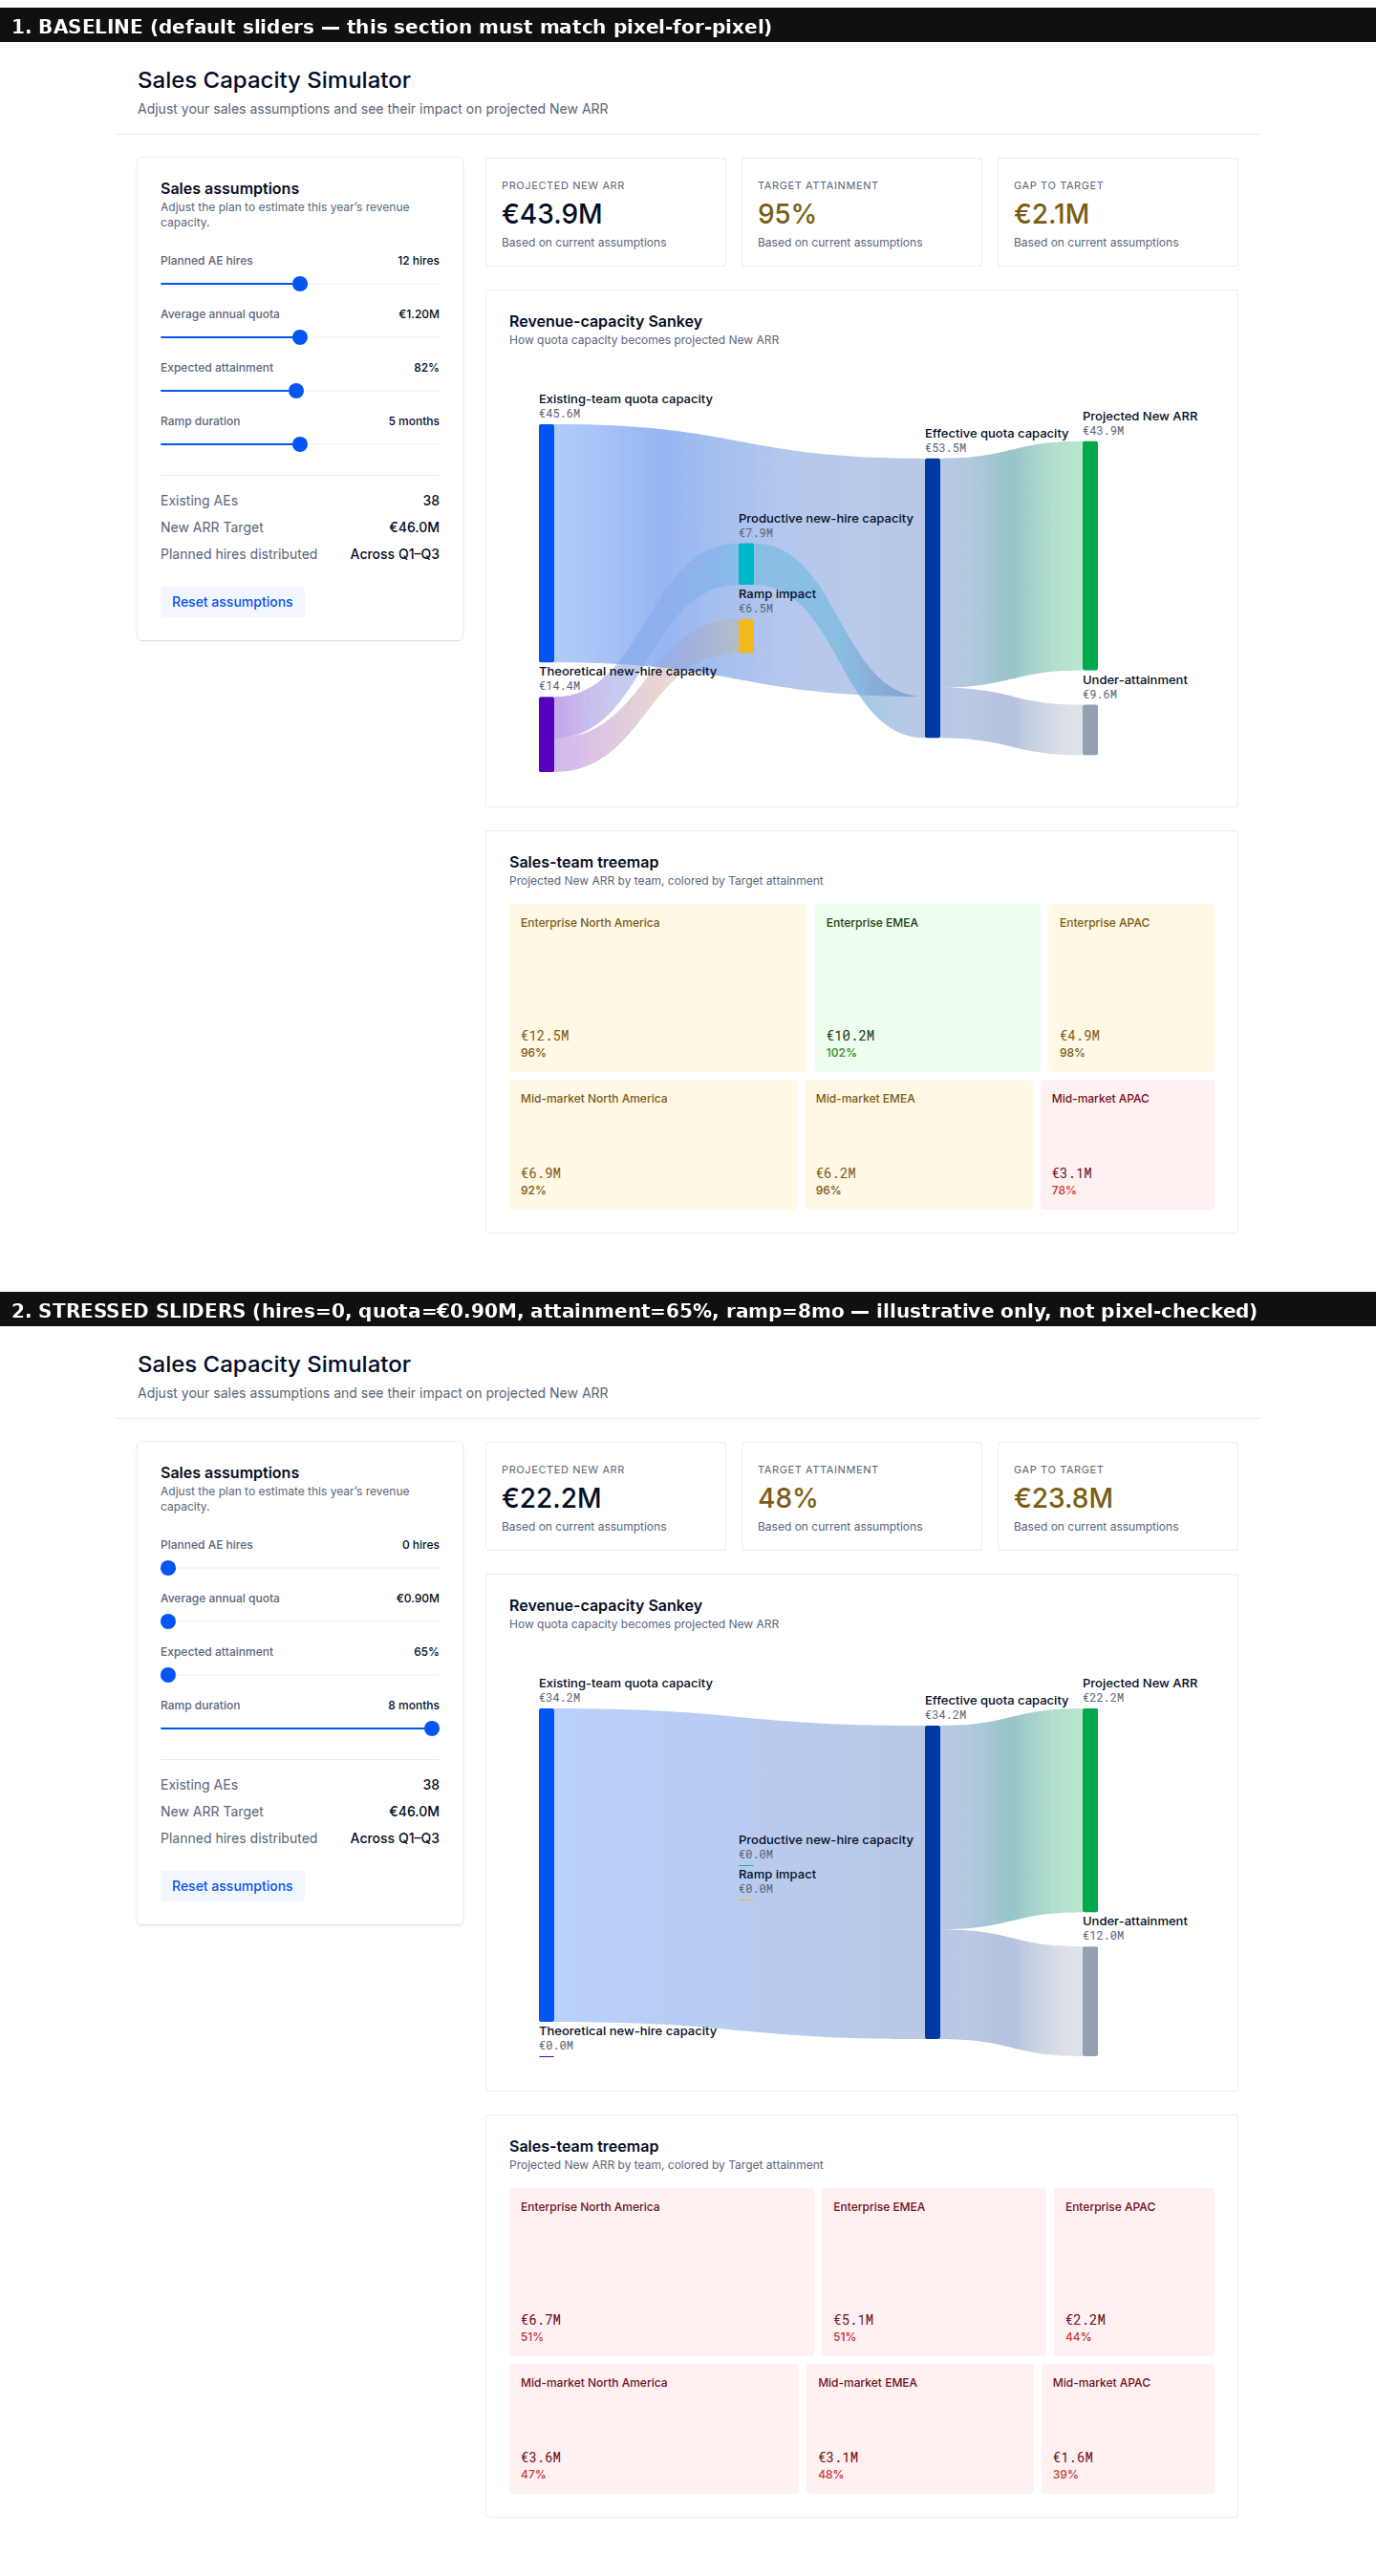
What to do:
Open and copy the prompt for this Frame. Paste it into the Modeler Agent chat.
Open and copy the prompt for this Frame. Paste it into the Modeler Agent chat.
Before building anything, ask me a few quick questions — one at a time, wait for my answer before asking the next one. Don't write any code or create anything until we're through all of them. Use the AskUser card to ask each question. **Question 1**: The attached screenshot is a sales-capacity what-if tool — drag four sliders (planned hires, average quota, expected attainment, ramp duration), see the impact on projected New ARR via a KPI row, a revenue-capacity flow diagram, and a per-team breakdown. Ask me simply: *"Does this use case match your intent, or were you picturing something a bit different?"* If I say something different, ask me to describe it in a sentence or two and go with that instead of the screenshot's version. **Question 2**: Ask me: *"Should I use made-up demo numbers for now, or hook this up to real data you already have in Pigment?"* **Question 3** (only if I said "real data" in Question 2): Ask me: *"Which List, Metric, or Table should it use?"* Wait for me to name it — don't guess or invent names. **Question 4** (only if I said "made-up demo numbers" in Question 2): Ask me: *"Want me to just fake it for now, or actually set up real Lists/Metrics for this later?"* If I want it set up for real, ask where (which Application/folder) before creating anything. **Then build it.** Tell me first that building the frame can take up to 10 minutes. Use my answers for what the tool actually does and where its data comes from. For the *look* — colors, card layout, fonts, spacing — match the attached screenshot's style exactly, regardless of what we land on for Questions 1–4. **If I said "made-up demo numbers" in Question 2 and the tool is still basically this sales-capacity idea** (i.e. I didn't redirect it to something substantially different in Question 1), use this exact dataset verbatim instead of inventing your own — it's already internally consistent and screenshot-accurate, so there's no need to make up or tune numbers: ```js
var MODEL = { existingAEs: 38, targetNewARR: 46, // €M defaults: { plannedHires: 12, annualQuota: 1.2, attainment: 0.82, rampMonths: 5 }
}; var TEAMS = [ { name: 'Enterprise North America', existingShare: 0.30, hireShare: 0.20, target: 13.0 }, { name: 'Enterprise EMEA', existingShare: 0.23, hireShare: 0.25, target: 10.0 }, { name: 'Enterprise APAC', existingShare: 0.10, hireShare: 0.18, target: 5.0 }, { name: 'Mid-market North America', existingShare: 0.16, hireShare: 0.14, target: 7.5 }, { name: 'Mid-market EMEA', existingShare: 0.14, hireShare: 0.15, target: 6.5 }, { name: 'Mid-market APAC', existingShare: 0.07, hireShare: 0.08, target: 4.0 }
];
// existingShare sums to 1.00 across all 6 teams; hireShare sums to 1.00 across all 6 teams. var SLIDERS = [ { key: 'plannedHires', label: 'Planned AE hires', min: 0, max: 24, step: 1, format: v => v + ' hires' }, { key: 'annualQuota', label: 'Average annual quota', min: 0.9, max: 1.5, step: 0.05, format: v => '€' + v.toFixed(2) + 'M' }, { key: 'attainment', label: 'Expected attainment', min: 0.65, max: 1.0, step: 0.01, format: v => Math.round(v * 100) + '%' }, { key: 'rampMonths', label: 'Ramp duration', min: 2, max: 8, step: 1, format: v => v + ' months' }
]; // Calculation model:
// existingCapacity = MODEL.existingAEs * annualQuota
// theoreticalHireCapacity = plannedHires * annualQuota
// rampFactor = clamp(0.8 - 0.05 * rampMonths, 0.35, 0.7)
// productiveHireCapacity = theoreticalHireCapacity * rampFactor
// effectiveCapacity = existingCapacity + productiveHireCapacity
// projectedNewARR = effectiveCapacity * attainment
// gapToTarget = MODEL.targetNewARR - projectedNewARR
// per team: teamEffectiveCapacity = existingCapacity*team.existingShare + productiveHireCapacity*team.hireShare
// teamProjectedARR = teamEffectiveCapacity * attainment; teamTargetAttainment = teamProjectedARR / team.target
// Trust these numbers and formulas as-is — don't re-derive or invent your own.
```
If instead Question 1 redirected this to a meaningfully different tool, or Question 2 pointed to real Pigment data, this dataset doesn't apply — build whatever the real answers call for. ## Visual style — light, clean SaaS theme
Use these exact tokens for the build, regardless of what the final data/use-case turns out to be. **Fonts**: system stacks only — sans `-apple-system, BlinkMacSystemFont, "Helvetica Neue", Arial, sans-serif`; monospace (tabular figures only) `ui-monospace, SFMono-Regular, "SF Mono", Menlo, Consolas, monospace`. Do not attempt to fetch or embed any custom web font (no network access in this environment). **Colors**:
- `white` `#FFFFFF`, `grey-10` `#F7F7F8`, `grey-20` `#E8EAED`, `grey-30` `#949FB2`, `grey-50` `#5A657A`, `grey-90` `#020D23`.
- Card border `rgba(2,13,35,0.08)`; subtle track fill `rgba(2,13,35,0.04)`.
- Accent (brand blue): `primary-20` `#95B9FF` (focus ring base), `primary-30` `#2684FF`, `primary-50` `#0355F3` (buttons, sliders, links), `primary-90` `#0038A4`.
- Semantic triad — every status maps to exactly one, never a raw color: **Positive** `#1A9F1A` base / `#EEFDEE` soft bg / `#094F09` text-on-tint. **Cautious** `#F3B921` base / `#FFF8E5` soft bg / `#7A5D11` text-on-tint. **Negative** `#D02B41` base / `#FFF0F2` soft bg / `#740C19` text-on-tint.
- Focus ring: `0 0 0 3px` of `primary-20`.
- Card shadow: `0 1px 1px 0 rgba(2,13,35,0.04), 0 0 0 1px rgba(2,13,35,0.06), 0 2px 5px 0 rgba(2,13,35,0.05)`. **Typography** (size / weight / line-height / color):
| Role | Size | Weight | Line-height | Color |
|---|---|---|---|---|
| Screen title | 24px | 500 | 32px | grey-90 |
| Page subtitle | 14px | 400 | 20px | grey-50 |
| Section title (card headers) | 16px | 600 | 24px | grey-90 |
| Running small (sub-copy) | 12px | 400 | 16px | grey-50 |
| Field label | 12px | 500 | 16px | grey-50 |
| KPI value | 28px | 500 | 36px | grey-90, or tone color if the KPI has a status |
| KPI label (uppercase) | 11px | 400 | 16px | grey-50 | **Components**: corner radius 4px on cards/tiles, fully rounded (5000px) on slider thumb/track and pills. Card padding `20px 24px 24px` (tighter 20px top) unless a component clearly needs its own override. Slider track 2px tall fully rounded, thumb a 16px circle. Motion: 150ms ease-in for quick hover/press feedback, 200ms ease-in-out for value/color transitions (e.g. a breakdown tile resizing or recoloring after a slider move). ## Quality bar
No console errors. Whatever data source we land on, keep every panel deriving from the same underlying values so nothing contradicts on screen. Clean up all listeners/timers/DOM the frame added when re-mounted.
Download this image. Attach it to the Modeler Agent chat to guide the Frame’s design.
Download this image. Attach it to the Modeler Agent chat to guide the Frame’s design.
Explore a compensation planning Frame built in Pigment. Apply salary growth and bonus assumptions and trace the cost impact to every employee, department, and org chart. See it in action.
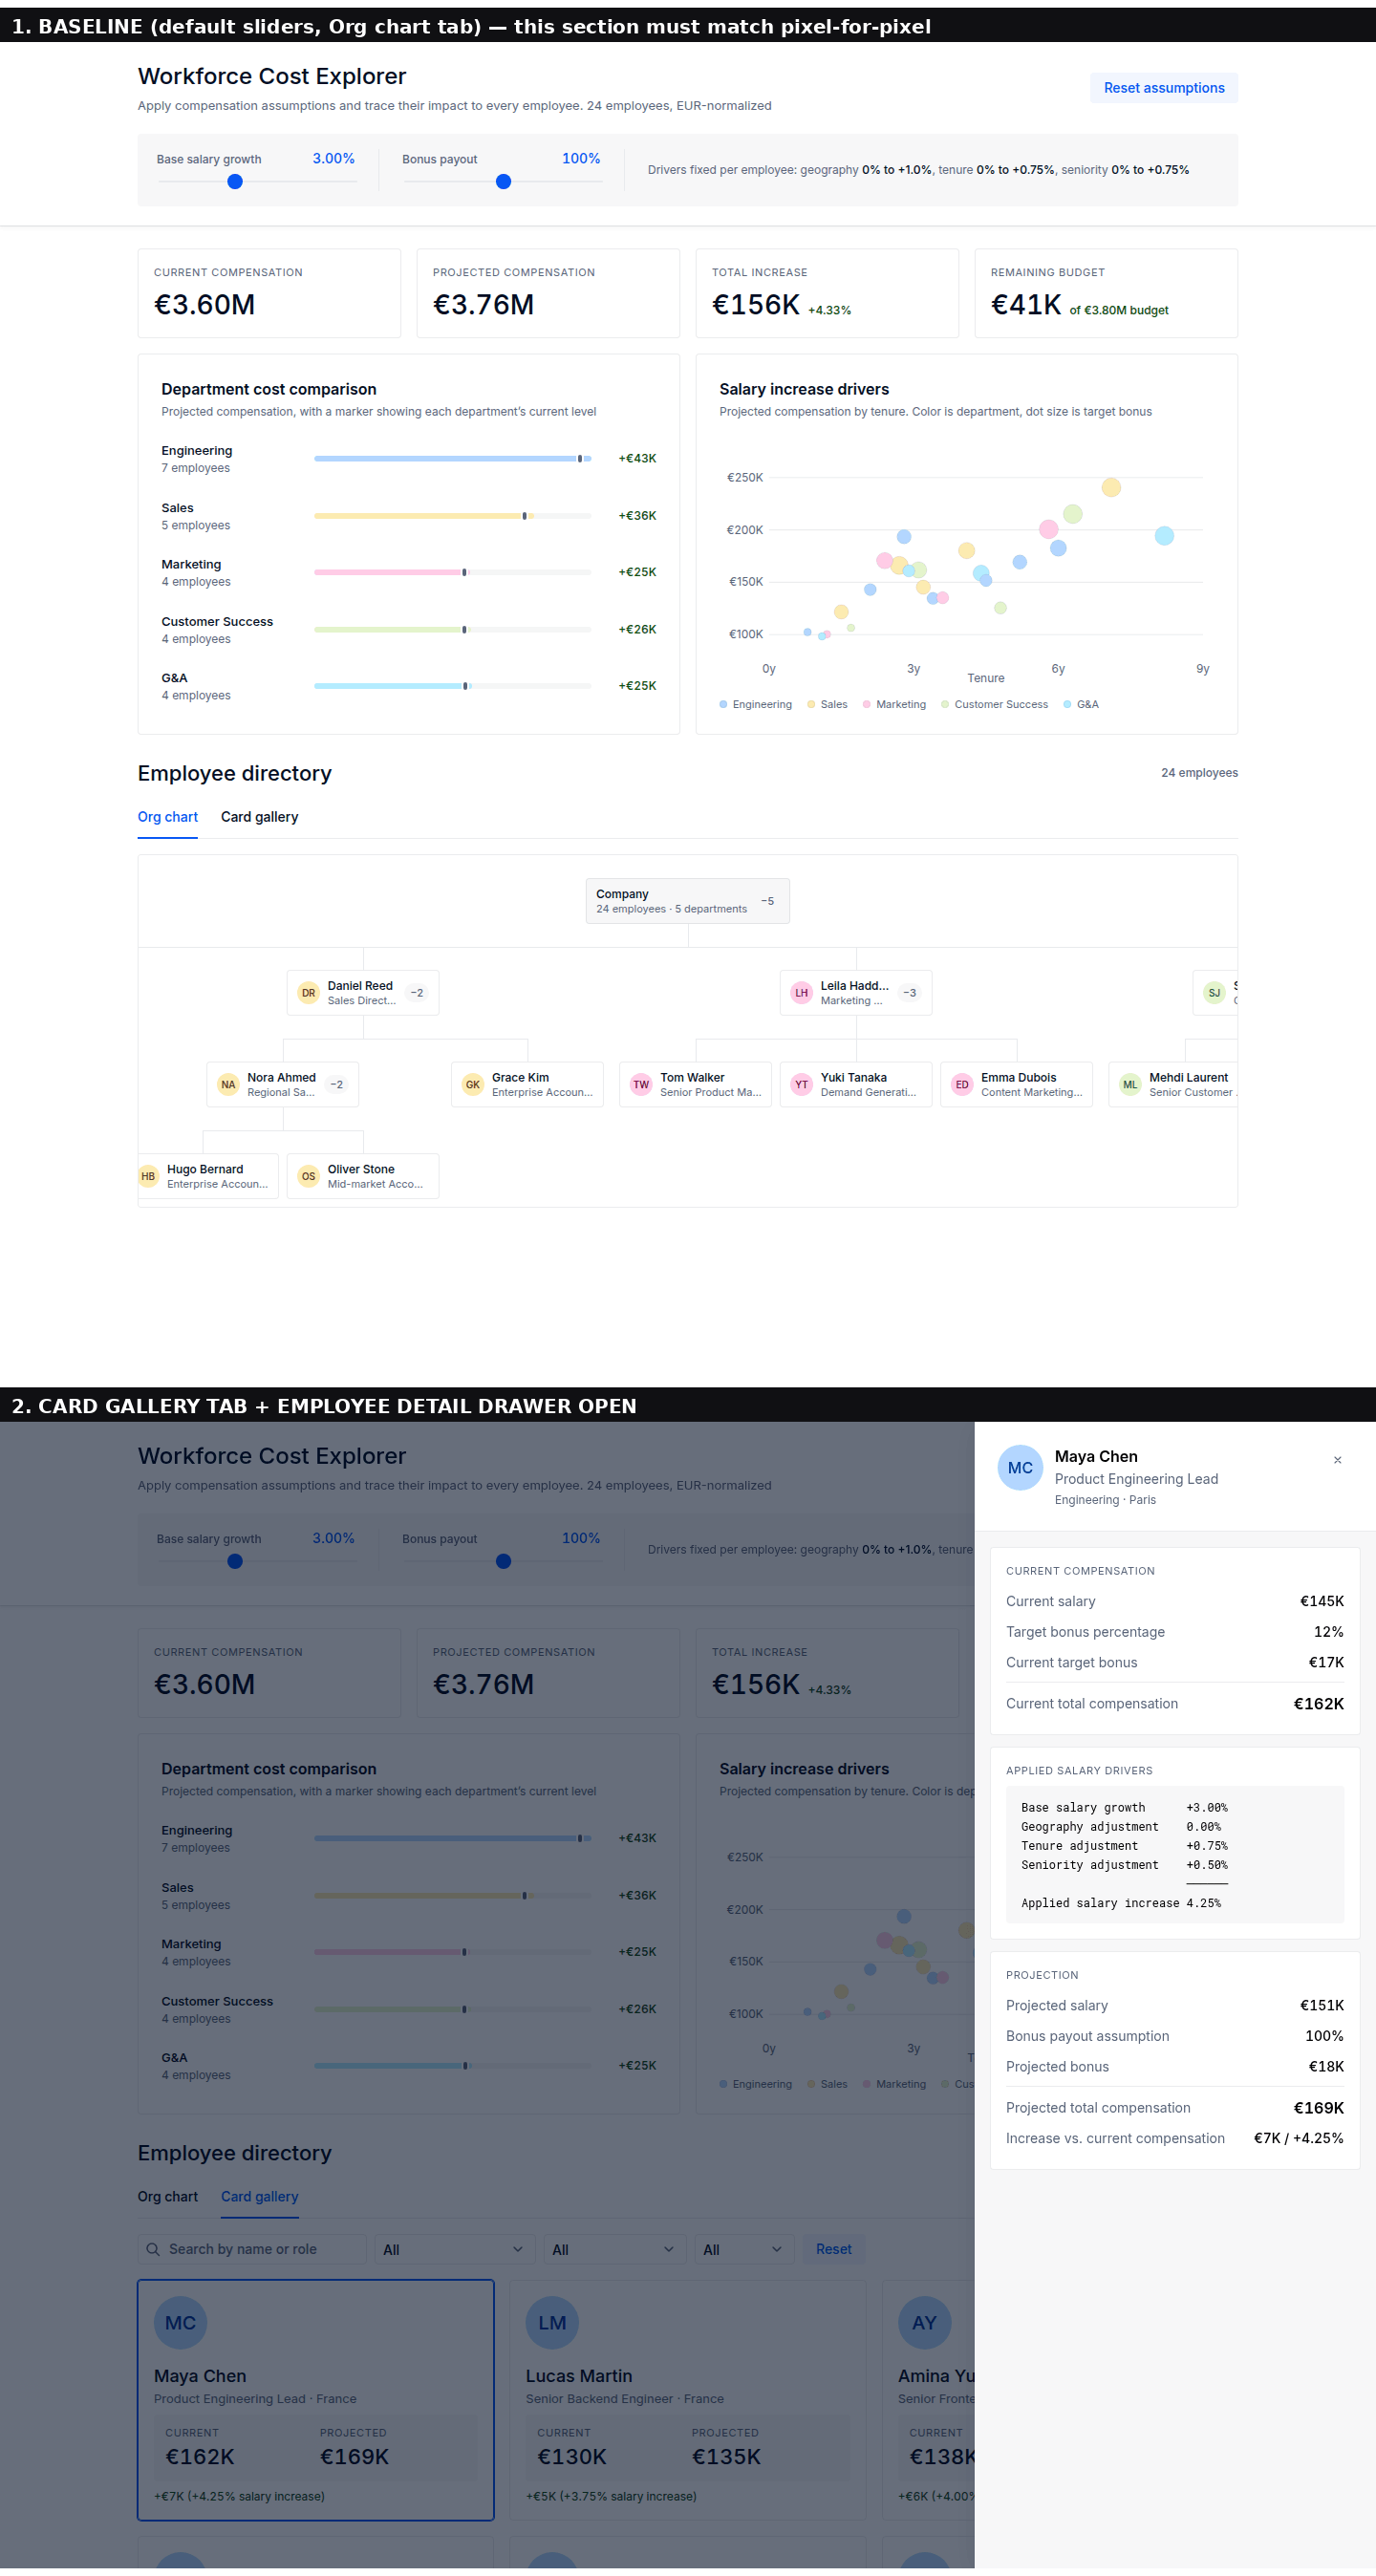
What to do:
Open and copy the prompt for this Frame. Paste it into the Modeler Agent chat.
Open and copy the prompt for this Frame. Paste it into the Modeler Agent chat.
Before building anything, ask me a few quick questions — one at a time, wait for my answer before asking the next one. Don't write any code or create anything until we're through all of them. Use the AskUser card to ask each question. **Question 1**: The attached screenshot is a workforce cost explorer — two sliders for base salary growth and bonus payout assumptions drive a live recalculation across a KPI row, a department cost-comparison chart, a tenure-vs-compensation scatter plot, and a searchable/filterable employee directory (org chart or card gallery) with a per-employee detail drawer showing the full salary/bonus breakdown. Ask me simply: *"Does this use case match your intent, or were you picturing something a bit different?"* If I say something different, ask me to describe it in a sentence or two and go with that instead of the screenshot's version. **Question 2**: Ask me: *"Should I use made-up demo numbers for now, or hook this up to real data you already have in Pigment?"* **Question 3** (only if I said "real data" in Question 2): Ask me: *"Which List, Metric, or Table should it use?"* Wait for me to name it — don't guess or invent names. **Question 4** (only if I said "made-up demo numbers" in Question 2): Ask me: *"Want me to just fake it for now, or actually set up real Lists/Metrics for this later?"* If I want it set up for real, ask where (which Application/folder) before creating anything. **Then build it.** Tell me first that building the frame can take up to 10 minutes. Before writing any code, open and actually look at the attached screenshot — every panel, including the org chart. Skipping this step is the single biggest cause of a wrong build (and a wrong build is far slower to fix than reading the image once up front). Use my answers for what the tool actually does and where its data comes from. For the *look* — colors, card layout, fonts, spacing — match the attached screenshot's style exactly, regardless of what we land on for Questions 1–4. Write the Frame in one file pass — assemble the full body and write it once (or in 2–3 large passes at most), not as many small incremental edits. The dataset and design tokens below are for you to wire directly into the code; reference them by name in your own response rather than re-pasting the full arrays/objects back — restating them adds length without adding anything I need to review. **If I said "made-up demo numbers" in Question 2 and the tool is still basically this workforce-cost idea** (i.e. I didn't redirect it to something substantially different in Question 1), use this exact dataset verbatim instead of inventing your own — it's already internally consistent and screenshot-accurate, so there's no need to make up or tune numbers: ```js
var BUDGET_K = 3800; // FY27 Compensation Budget, thousands of EUR var DEPARTMENTS = [ { name: 'Engineering', chart: '#B3D6FF', fg: '#013496', bg: '#B3D6FF' }, { name: 'Sales', chart: '#FBEBB1', fg: '#523B00', bg: '#FBEBB1' }, { name: 'Marketing', chart: '#FFCCE6', fg: '#740741', bg: '#FFCCE6' }, { name: 'Customer Success', chart: '#E4F4CC', fg: '#1D673E', bg: '#E4F4CC' }, { name: 'G&A', chart: '#B3ECFF', fg: '#005161', bg: '#B3ECFF' }
]; var GEOGRAPHY_ADJUSTMENT = { 'France': 0, 'Germany': 0.0025, 'United Kingdom': 0.005, 'Singapore': 0.0075, 'United States': 0.01
}; var SENIORITY_ADJUSTMENT = { 'Mid-level': 0, 'Senior': 0.0025, 'Lead': 0.005, 'Manager': 0.005, 'Director': 0.0075
}; // Tenure adjustment is a threshold bucket, not a lookup table:
// >=5y -> 0.0075, >=3y -> 0.005, >=1y -> 0.0025, else 0 var EMPLOYEES = [ { id: 'emp-01', name: 'Maya Chen', role: 'Product Engineering Lead', department: 'Engineering', geography: 'France', location: 'Paris', seniority: 'Lead', tenureYears: 5.2, currentSalaryK: 145, targetBonus: 0.12 }, { id: 'emp-02', name: 'Lucas Martin', role: 'Senior Backend Engineer', department: 'Engineering', geography: 'France', location: 'Paris', seniority: 'Senior', tenureYears: 3.4, currentSalaryK: 118, targetBonus: 0.10 }, { id: 'emp-03', name: 'Amina Yusuf', role: 'Senior Frontend Engineer', department: 'Engineering', geography: 'United Kingdom', location: 'London', seniority: 'Senior', tenureYears: 2.1, currentSalaryK: 125, targetBonus: 0.10 }, { id: 'emp-04', name: 'Jonas Weber', role: 'Engineering Manager', department: 'Engineering', geography: 'Germany', location: 'Berlin', seniority: 'Manager', tenureYears: 6.0, currentSalaryK: 152, targetBonus: 0.15 }, { id: 'emp-05', name: 'Priya Nair', role: 'Senior Data Engineer', department: 'Engineering', geography: 'Singapore', location: 'Singapore', seniority: 'Senior', tenureYears: 4.5, currentSalaryK: 132, targetBonus: 0.10 }, { id: 'emp-06', name: 'Ethan Brooks', role: 'Platform Engineering Lead', department: 'Engineering', geography: 'United States', location: 'New York', seniority: 'Lead', tenureYears: 2.8, currentSalaryK: 165, targetBonus: 0.12 }, { id: 'emp-07', name: 'Sofia Rossi', role: 'Product Engineer', department: 'Engineering', geography: 'France', location: 'Paris', seniority: 'Mid-level', tenureYears: 0.8, currentSalaryK: 92, targetBonus: 0.08 }, { id: 'emp-08', name: 'Daniel Reed', role: 'Sales Director', department: 'Sales', geography: 'United States', location: 'New York', seniority: 'Director', tenureYears: 7.1, currentSalaryK: 190, targetBonus: 0.20 }, { id: 'emp-09', name: 'Nora Ahmed', role: 'Regional Sales Manager', department: 'Sales', geography: 'United Kingdom', location: 'London', seniority: 'Manager', tenureYears: 4.1, currentSalaryK: 150, targetBonus: 0.15 }, { id: 'emp-10', name: 'Hugo Bernard', role: 'Enterprise Account Executive', department: 'Sales', geography: 'France', location: 'Paris', seniority: 'Senior', tenureYears: 3.2, currentSalaryK: 125, targetBonus: 0.12 }, { id: 'emp-11', name: 'Grace Kim', role: 'Enterprise Account Executive', department: 'Sales', geography: 'Singapore', location: 'Singapore', seniority: 'Senior', tenureYears: 2.7, currentSalaryK: 135, targetBonus: 0.18 }, { id: 'emp-12', name: 'Oliver Stone', role: 'Mid-market Account Executive', department: 'Sales', geography: 'Germany', location: 'Berlin', seniority: 'Mid-level', tenureYears: 1.5, currentSalaryK: 105, targetBonus: 0.12 }, { id: 'emp-13', name: 'Leila Haddad', role: 'Marketing Director', department: 'Marketing', geography: 'France', location: 'Paris', seniority: 'Director', tenureYears: 5.8, currentSalaryK: 160, targetBonus: 0.20 }, { id: 'emp-14', name: 'Tom Walker', role: 'Senior Product Marketing Manager', department: 'Marketing', geography: 'United Kingdom', location: 'London', seniority: 'Senior', tenureYears: 3.6, currentSalaryK: 118, targetBonus: 0.10 }, { id: 'emp-15', name: 'Yuki Tanaka', role: 'Demand Generation Manager', department: 'Marketing', geography: 'Singapore', location: 'Singapore', seniority: 'Manager', tenureYears: 2.4, currentSalaryK: 142, targetBonus: 0.15 }, { id: 'emp-16', name: 'Emma Dubois', role: 'Content Marketing Manager', department: 'Marketing', geography: 'France', location: 'Paris', seniority: 'Mid-level', tenureYears: 1.2, currentSalaryK: 90, targetBonus: 0.08 }, { id: 'emp-17', name: 'Sara Johnson', role: 'Customer Success Director', department: 'Customer Success', geography: 'United States', location: 'New York', seniority: 'Director', tenureYears: 6.3, currentSalaryK: 170, targetBonus: 0.20 }, { id: 'emp-18', name: 'Mehdi Laurent', role: 'Senior Customer Success Manager', department: 'Customer Success', geography: 'France', location: 'Paris', seniority: 'Senior', tenureYears: 4.8, currentSalaryK: 110, targetBonus: 0.10 }, { id: 'emp-19', name: 'Anna Schmidt', role: 'Customer Success Manager', department: 'Customer Success', geography: 'Germany', location: 'Berlin', seniority: 'Manager', tenureYears: 3.1, currentSalaryK: 135, targetBonus: 0.15 }, { id: 'emp-20', name: 'Chloe Brown', role: 'Customer Success Manager', department: 'Customer Success', geography: 'United Kingdom', location: 'London', seniority: 'Mid-level', tenureYears: 1.7, currentSalaryK: 95, targetBonus: 0.08 }, { id: 'emp-21', name: 'Camille Moreau', role: 'Finance Director', department: 'G&A', geography: 'France', location: 'Paris', seniority: 'Director', tenureYears: 8.2, currentSalaryK: 155, targetBonus: 0.20 }, { id: 'emp-22', name: 'James Wilson', role: 'People Operations Manager', department: 'G&A', geography: 'United Kingdom', location: 'London', seniority: 'Manager', tenureYears: 4.4, currentSalaryK: 132, targetBonus: 0.15 }, { id: 'emp-23', name: 'Fatima Khan', role: 'Senior Legal Counsel', department: 'G&A', geography: 'United States', location: 'New York', seniority: 'Senior', tenureYears: 2.9, currentSalaryK: 140, targetBonus: 0.10 }, { id: 'emp-24', name: 'Leon Fischer', role: 'Financial Analyst', department: 'G&A', geography: 'Germany', location: 'Berlin', seniority: 'Mid-level', tenureYears: 1.1, currentSalaryK: 88, targetBonus: 0.08 }
]; // Reporting lines (org chart): department heads (emp-04, emp-08, emp-13,
// emp-17, emp-21) report to null and sit under a synthetic non-employee
// "Company" root node. Everyone else maps employeeId -> managerId, e.g.
// 'emp-01': 'emp-04', 'emp-02': 'emp-01', 'emp-07': 'emp-01', 'emp-06': 'emp-04',
// 'emp-03': 'emp-06', 'emp-05': 'emp-06', 'emp-09': 'emp-08', 'emp-10': 'emp-09',
// 'emp-12': 'emp-09', 'emp-11': 'emp-08', 'emp-14': 'emp-13', 'emp-15': 'emp-13',
// 'emp-16': 'emp-13', 'emp-18': 'emp-17', 'emp-19': 'emp-17', 'emp-20': 'emp-19',
// 'emp-22': 'emp-21', 'emp-23': 'emp-21', 'emp-24': 'emp-21'. var DEFAULT_ASSUMPTIONS = { baseSalaryGrowth: 0.03, bonusPayout: 1 }; // sliders: growth 0%-8% step 0.25pp, payout 50%-150% step 5pp // Calculation model (per employee):
// geoAdj = GEOGRAPHY_ADJUSTMENT[employee.geography] || 0
// tenureAdj = tenure bucket above, from employee.tenureYears
// seniorityAdj = SENIORITY_ADJUSTMENT[employee.seniority] || 0
// appliedSalaryIncrease = baseSalaryGrowth + geoAdj + tenureAdj + seniorityAdj
// projectedSalary = employee.currentSalaryK * (1 + appliedSalaryIncrease)
// currentBonus = employee.currentSalaryK * employee.targetBonus
// projectedBonus = projectedSalary * employee.targetBonus * bonusPayout
// currentCompensation = employee.currentSalaryK + currentBonus
// projectedCompensation = projectedSalary + projectedBonus
//
// Aggregates: totalCurrent/totalProjected = sum over all employees;
// totalIncrease = totalProjected - totalCurrent; totalIncreasePct = totalIncrease / totalCurrent;
// remainingBudget = BUDGET_K - totalProjected; per department: same current/projected/count rollup.
// Trust these numbers and formulas as-is — don't re-derive or invent your own.
```
If instead Question 1 redirected this to a meaningfully different tool, or Question 2 pointed to real Pigment data, this dataset doesn't apply — build whatever the real answers call for. ## Visual style — light, clean SaaS theme
Use these exact tokens for the build, regardless of what the final data/use-case turns out to be. **Fonts**: system stacks only — sans `-apple-system, BlinkMacSystemFont, "Helvetica Neue", Arial, sans-serif`; monospace (tabular figures, breakdown text) `ui-monospace, SFMono-Regular, "SF Mono", Menlo, Consolas, monospace`. Do not attempt to fetch or embed any custom web font (no network access in this environment). **Icons** — verbatim hand-drawn SVG markup from the source, reuse as-is:
```html
<!-- Search icon -->
<svg width="16" height="16" viewBox="0 0 16 16" fill="none"><circle cx="7" cy="7" r="5" stroke="#5A657A" stroke-width="1.5"/><path d="M11 11L14.5 14.5" stroke="#5A657A" stroke-width="1.5" stroke-linecap="round"/></svg> <!-- Close (X) icon -->
<svg viewBox="0 0 16 16" fill="none"><path d="M4 4l8 8M12 4l-8 8" stroke="currentColor" stroke-width="1.5" stroke-linecap="round"/></svg>
``` **Design tokens — exact values, machine-readable**:
```js
var TOKENS = { color: { white: '#FFFFFF', grey10: '#F7F7F8', grey20: '#E8EAED', grey30: '#949FB2', grey50: '#5A657A', grey90: '#020D23', neutralAlpha: 'rgba(2,13,35,0.08)', backgroundAlpha: 'rgba(2,13,35,0.04)', primary10: '#F0F5FF', primary20: '#95B9FF', primary30: '#2684FF', primary50: '#0355F3', primary90: '#0038A4', primaryLightTransparent: 'rgba(3,85,243,0.05)', positive10: '#EEFDEE', positive50: '#1A9F1A', positive90: '#094F09', negative10: '#FFF0F2', negative50: '#D02B41', negative90: '#740C19', backdrop: 'rgba(2,13,35,0.6)', department: { Engineering: { chart: '#B3D6FF', fg: '#013496', bg: '#B3D6FF' }, Sales: { chart: '#FBEBB1', fg: '#523B00', bg: '#FBEBB1' }, Marketing: { chart: '#FFCCE6', fg: '#740741', bg: '#FFCCE6' }, 'Customer Success': { chart: '#E4F4CC', fg: '#1D673E', bg: '#E4F4CC' }, 'G&A': { chart: '#B3ECFF', fg: '#005161', bg: '#B3ECFF' } } }, // typography[role] = [size, weight, lineHeight, color] typography: { screenTitle: ['24px', 500, '32px', '#020D23'], pageSubtitle: ['13px', 400, '20px', '#5A657A'], contentTitle: ['22px', 500, '32px', '#020D23'], sectionTitle: ['16px', 600, '24px', '#020D23'], cardCopy: ['12px', 400, '16px', '#5A657A'], fieldLabel: ['12px', 500, '16px', '#5A657A'], fieldValue: ['14px', 500, '20px', '#0355F3'], kpiValue: ['28px', 500, '36px', '#020D23'], kpiLabel: ['11px', 400, '16px', '#5A657A'], kpiSub: ['12px', 500, '16px', '#5A657A'], button: ['14px', 500, '20px', null], empName: ['14px', 500, '20px', '#020D23'], empRole: ['12px', 400, '16px', '#5A657A'], drawerName: ['16px', 600, '24px', '#020D23'], drawerRole: ['14px', 400, '20px', '#5A657A'], sectionLabelUppercase: ['11px', 400, '16px', '#5A657A'], breakdown: ['12px', 400, '20px', '#020D23'] }, radius: { standard: '4px', pill: '5000px' }, spacing: { cardPadding: '20px 24px 24px', kpiPadding: '16px', drawerPadding: '24px', gapSmall: '8px', gapMedium: '16px', gapLarge: '24px' }, shadow: { stickyHeader: '0 1px 1px 0 rgba(2,13,35,0.04),0 0 0 1px rgba(2,13,35,0.06),0 2px 5px 0 rgba(2,13,35,0.05)', hoverCard: 'rgba(2,13,35,0.08) 0px 2px 17px -1px,rgba(2,13,35,0.04) 0px 1px 1px 0px', tooltipDrawer: '0px 0px 0px 1px hsl(220deg 89.2% 7.25% / 5%),0px 6px 10px -6px hsl(220deg 89.2% 7.25% / 12%),0px 6px 20px 0px hsl(220deg 89.2% 7.25% / 16%)', focusRing: '0 0 0 3px #95B9FF', selectedOutline: '0 0 0 1px #0355F3' }, motion: { quick: '150ms ease-in', value: '200ms ease-in-out' }
};
``` ## Quality bar
No console errors. Whatever data source we land on, keep every panel — KPI row, department bars, scatter plot, directory, drawer — deriving from the same underlying values so nothing contradicts on screen. Clean up all listeners/timers/DOM the frame added when re-mounted.
Download this image. Attach it to the Modeler Agent chat to guide the Frame’s design.
Download this image. Attach it to the Modeler Agent chat to guide the Frame’s design.