Pigment has functions and methodologies to help you add forecasts to your models. This article guides you through the options.
Background
Pigment’s forecasting tools fall into three main approaches. To help you choose which is best for your needs, this table characterizes the key data types and contexts for each option. The options are expanded on beneath.
Growth hypotheses | Regressions | Exponential smoothing | |
|---|---|---|---|
Data characterization | “My data from previous months is not useful for modelling the future.” | “My sales next year will be driven by three new launches. Therefore the sales behavior will in part follow my Inventory Metric.” | “External factors don’t affect my data in a way I can predict. The past will be a good guide if I can tune out ‘noise’.” |
Context example | A start-up grew rapidly off a small base last year, but now wants to apply 20% year-on-year growth for the rest of the year. | A scale-up sees a number of measurable external factors driving behavior next year. | An enterprise has no specific assumptions about the relationship between data points. |
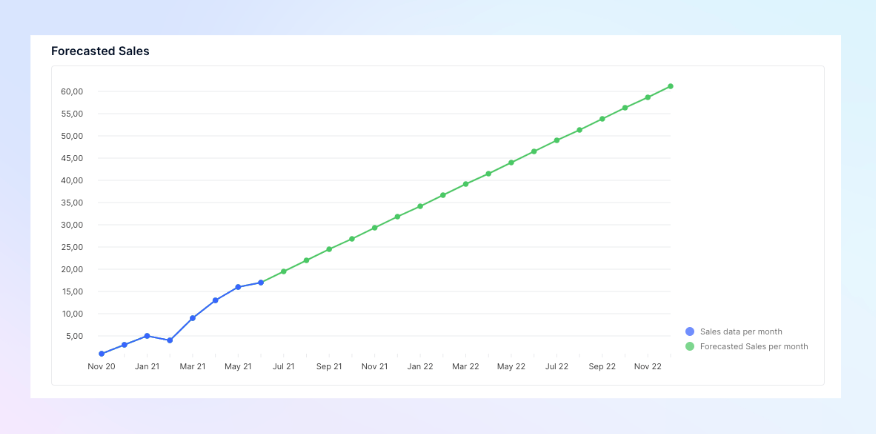
Growth hypotheses
The first approach to forecasting in Pigment uses a growth rate hypothesis to predict future months of a given Metric. For example, you can hypothesize that year-on-year growth will be 20%, and to model this you apply the hypothesized rate to month data from last year.
Using Growth Hypotheses to Forecast Revenue gives examples of the formulas and Metrics to create for this.
Regressions
Linear regression
For simple forecasting, the FORECAST_LINEAR function fits a straight line to your data using the ordinary least squares method for linear regressions. It returns a forecast of the following type:
This function requires just one mandatory argument and so is convenient for simple forecasting. It does not account for seasonality.
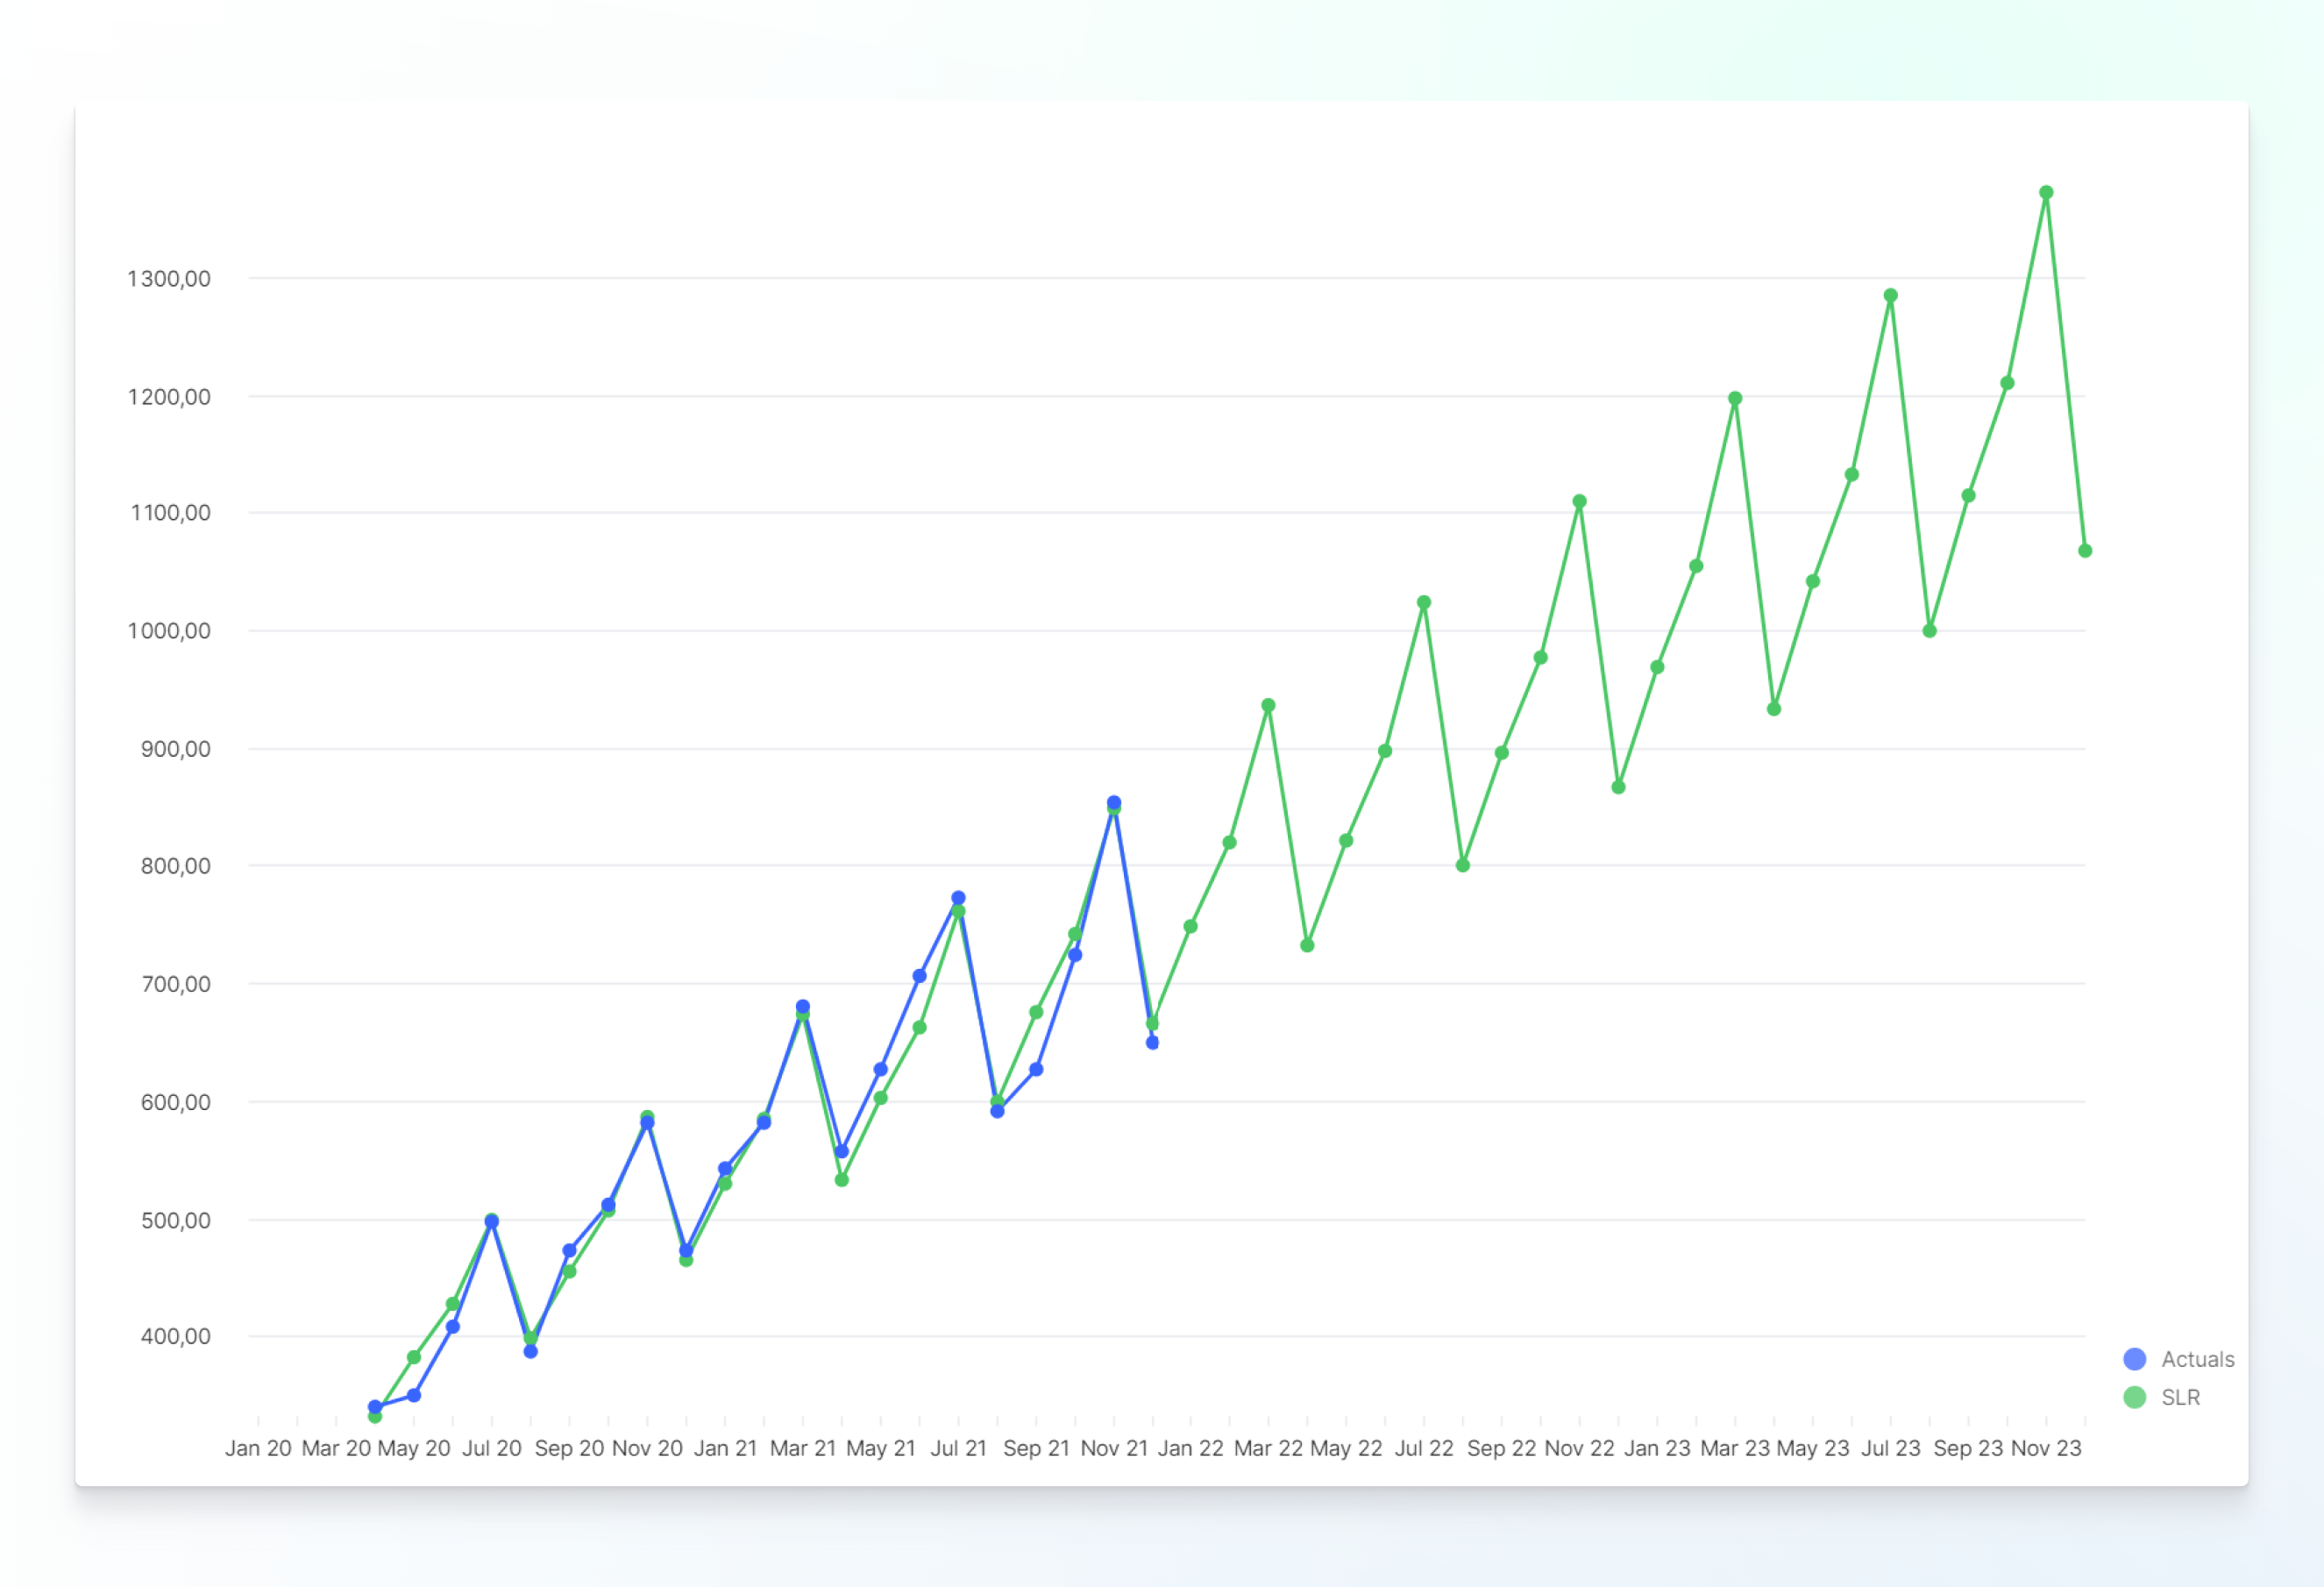
Seasonal linear regression
You can create a forecast comprising a simple linear regression with added seasonality, using the SEASONAL_LINEAR_REGRESSION function. Its methodology is similar to the FORECAST_LINEAR function, but has an additional required argument: length of seasonality. Defining this allows the model to produce forecasts of this kind:
Exponential smoothing tools
Exponential smoothing tools let modelers use data smoothing, trend smoothing, and seasonality smoothing factors to customize the forecast.
Simple
If your data does not show specific trends or seasonality, the SIMPLE_EXPONENTIAL_SMOOTHING function allows you to model your forecast with one smoothing factor:
alpha - for data smoothing, used to control the model’s sensitivity to the most recent data point
Double
If your data shows trends but does not show seasonality, the DOUBLE_EXPONENTIAL_SMOOTHING function allows you to model your forecast with two smoothing factors, the above and:
beta - for trend smoothing, used to control the model’s sensitivity to the most recent changes in the trend, allowing the model to adapt more or less quickly to shifts in the trend direction
Triple
For data with seasonality, the triple exponential tool FORECAST_ETS allows modelers the above smoothing factors along with:
gamma - for seasonality smoothing, used to control the model’s sensitivity to the most recent seasonal values, allowing the model to adapt more or less quickly to changes in the seasonal pattern
Machine Learning tools
Pigment’s Prediction tool generates customized forecasts automatically for inclusion in your model. It leverages advanced statistical and Machine Learning algorithms to analyze your historical data and make predictions about future values. You can use it for a wide range of planning needs, including demand planning, financial forecasting, or revenue projections. Use it with any time-dependent Metric in your Pigment Workspace. See here for more details.